Nordstrom 2013 Annual Report Download - page 22
Download and view the complete annual report
Please find page 22 of the 2013 Nordstrom annual report below. You can navigate through the pages in the report by either clicking on the pages listed below, or by using the keyword search tool below to find specific information within the annual report.-
 1
1 -
2
-
3
-
4
-
5
-
6
-
7
-
8
-
9
-
10
-
11
-
 12
12 -
 13
13 -
 14
14 -
 15
15 -
 16
16 -
 17
17 -
 18
18 -
 19
19 -
 20
20 -
 21
21 -
 22
22 -
 23
23 -
 24
24 -
 25
25 -
 26
26 -
 27
27 -
 28
28 -
 29
29 -
 30
30 -
 31
31 -
 32
32 -
33
-
34
-
35
-
36
-
37
-
38
-
39
-
40
-
41
-
42
-
43
-
44
-
45
-
46
-
47
-
48
-
49
-
50
-
51
-
52
-
53
-
54
-
55
-
56
-
57
-
58
-
59
-
60
-
61
-
62
-
63
-
64
-
65
-
66
-
67
-
68
-
69
-
70
-
71
-
72
-
73
-
74
 |
 |

22
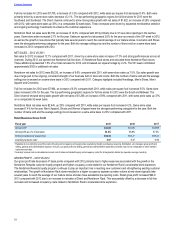
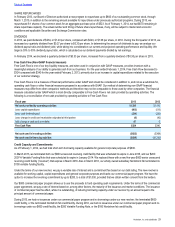
Allowance for Credit Losses and Credit Trends
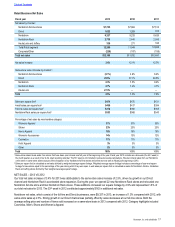
The following table illustrates activity in the allowance for credit losses:
Fiscal year 2013 2012 2011
Allowance at beginning of year $85 $115 $145
Bad debt expense 52 42 84
Write-offs (80) (97) (136)
Recoveries 23 25 22
Allowance at end of year $80 $85 $115
Net write-offs as a percentage of average credit card receivables 2.7% 3.5% 5.4%
Net write-offs (including finance charges and fees) as a percentage of average
credit card receivables 3.2% 4.1% 6.3%
30 days or more delinquent as a percentage of ending credit card receivables 1.8% 1.9% 2.6%
Allowance as a percentage of ending credit card receivables 3.7% 4.0% 5.5%
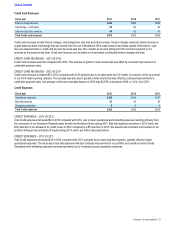
CREDIT TRENDS
During 2013, our delinquency and net write-off results continued to improve. Net write-offs in 2013 were $57, compared with $72 in 2012 and
$114 in 2011. As delinquencies and net write-offs improved in both 2013 and 2012, we reduced our allowance for credit losses by $5 in 2013
and $30 in 2012.
CREDIT QUALITY
The quality of our credit card receivables at any time reflects, among other factors, general economic conditions, the creditworthiness of our
cardholders and the success of our account management and collection activities. In general, credit quality tends to decline, and the risk of
credit losses tends to increase, during periods of deteriorating economic conditions. Through our underwriting and risk management
standards and practices, we seek to maintain a high-quality cardholder portfolio, thereby mitigating our exposure to credit losses. As of
February 1, 2014, 78.1% of our credit card receivables were from cardholders with FICO scores of 660 or above (generally considered
“prime” according to industry standards) compared with 78.3% as of February 2, 2013. See Note 3: Accounts Receivable in Item 8: Financial
Statements and Supplementary Data for additional information.
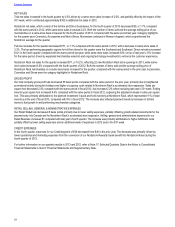
Intercompany Merchant Fees
Intercompany merchant fees represent the estimated costs that would be incurred if our cardholders used third-party cards in our Nordstrom
stores and online. In 2013, this estimate increased to $97 or 4.6% of average credit card receivables from $89 or 4.3% in 2012. This was
primarily driven by the increased use of our credit and debit cards in store and online, as reflected by an increase in inside volume as a
percent of total volume from 51.0% in 2012 to 53.6% in 2013.
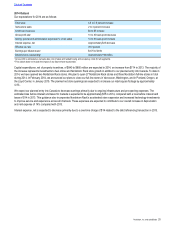
Total Company Results
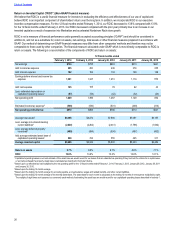
Interest Expense, Net
Fiscal year 2013 2012 2011
Interest on long-term debt and short-term borrowings $176 $167 $139
Less:
Interest income (1) (2) (2)
Capitalized interest (14) (5) (7)
Interest expense, net $161 $160 $130
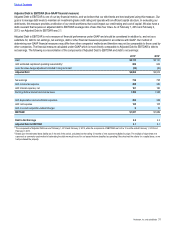
INTEREST EXPENSE, NET – 2013 VS 2012
Interest expense, net increased $1 in 2013 compared with 2012 due to $14 in non-recurring charges related to the debt refinancing, partially
offset by an increase in capitalized interest resulting primarily from planned capital investments related to our Manhattan store and
accelerated Nordstrom Rack growth. See further discussion of our debt retirement and exchange transaction at Note 8: Debt and Credit
Facilities in Item 8: Financial Statements and Supplementary Data.
INTEREST EXPENSE, NET – 2012 VS 2011
Interest expense, net increased $30 in 2012 compared with 2011 due to higher average interest rates and higher average debt balances.
Table of Contents