Nordstrom 2013 Annual Report Download - page 24
Download and view the complete annual report
Please find page 24 of the 2013 Nordstrom annual report below. You can navigate through the pages in the report by either clicking on the pages listed below, or by using the keyword search tool below to find specific information within the annual report.-
 1
1 -
2
-
3
-
4
-
5
-
6
-
7
-
8
-
9
-
10
-
11
-
12
-
13
-
 14
14 -
 15
15 -
 16
16 -
 17
17 -
 18
18 -
 19
19 -
 20
20 -
 21
21 -
 22
22 -
 23
23 -
 24
24 -
 25
25 -
 26
26 -
 27
27 -
 28
28 -
 29
29 -
 30
30 -
 31
31 -
 32
32 -
 33
33 -
 34
34 -
35
-
36
-
37
-
38
-
39
-
40
-
41
-
42
-
43
-
44
-
45
-
46
-
47
-
48
-
49
-
50
-
51
-
52
-
53
-
54
-
55
-
56
-
57
-
58
-
59
-
60
-
61
-
62
-
63
-
64
-
65
-
66
-
67
-
68
-
69
-
70
-
71
-
72
-
73
-
74
 |
 |

24
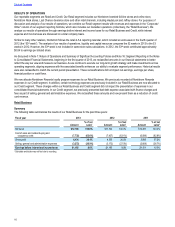
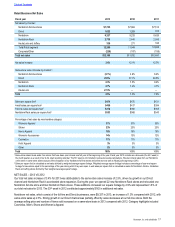
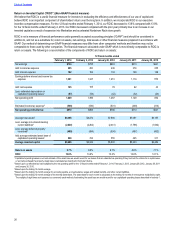
NET SALES
Total net sales increased in the fourth quarter by 0.5% driven by a same-store sales increase of 2.6%, and partially offset by the impact of the
53rd week, which contributed approximately $162 in additional net sales in 2012.
Nordstrom net sales, which consist of the full-line and Direct businesses, for the fourth quarter of 2013 decreased $50, or 1.7% compared
with the same period in 2012, while same-store sales increased 2.2%. Both the number of items sold and the average selling price of our
merchandise on a same-store basis increased for the fourth quarter of 2013, compared with the same period last year. Category highlights
for the quarter were Cosmetics, Accessories and Men's Shoes. Momentum continued in Women’s Apparel, which outperformed the
Nordstrom average for the quarter.
Full-line net sales for the quarter decreased $171, or 7.1% compared with the same period in 2012, with a decrease in same-store sales of
3.3%. The top-performing geographic regions for full-line stores for the quarter were the Southwest and Southeast. Direct net sales increased
$121 in the fourth quarter compared with the same period last year, while same-store sales increased 30% on top of last year’s 31% increase
for the same period, driven by expanded merchandise selection and ongoing technology investments to enhance the customer experience.
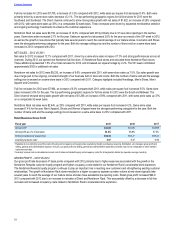
Nordstrom Rack net sales for the quarter increased $71, or 10.2%, reflecting 22 new Nordstrom Rack store openings in 2013, while same-
store sales increased 3.6% compared with the fourth quarter of 2012. Both the number of items sold and the average selling price of
Nordstrom Rack merchandise on a same-store basis increased for the quarter, compared with the same period in the prior year. Accessories,
Cosmetics and Shoes were the category highlights for Nordstrom Rack.
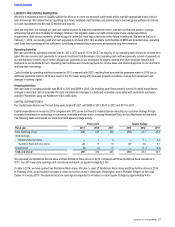
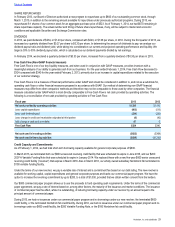
GROSS PROFIT
Our total company gross profit rate decreased 55 basis points compared with the same period in the prior year, primarily due to heightened
promotional activity during the holidays and higher occupancy costs related to Nordstrom Rack’s accelerated store expansion. Sales per
square foot decreased 2.4% compared with the same period in fiscal 2012, but increased 2.2% when excluding last year’s 53rd week. Ending
inventory per square foot increased 9.4% compared with the same period in fiscal 2012, outpacing the adjusted increase in sales per square
foot. This was primarily attributable to the planned investment in pack and hold inventory at Nordstrom Rack, which represented 11% of total
inventory at the end of fiscal 2013, compared with 9% in fiscal 2012. The increase also reflected planned inventory increases in full-line
stores to fuel growth in well-performing merchandise categories.
RETAIL SELLING, GENERAL & ADMINISTRATIVE EXPENSES
Our Retail SG&A rate decreased 8 basis points primarily due to lower selling expenses, partially offset by growth-related investments for the
planned entry into Canada and for Nordstrom Rack’s accelerated store expansion. Selling, general and administrative expenses for our
Retail Business increased $1 compared with last year’s fourth quarter. The increase was primarily attributable to higher fulfillment costs,
partially offset by lower selling expenses and an additional week of expenses in 2012 due to the 53rd week.
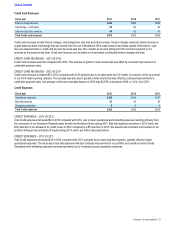
CREDIT EXPENSES
In the fourth quarter, expenses for our Credit segment of $38 decreased from $46 in the prior year. The decrease was primarily driven by
lower operational and marketing expenses from the conversion of our Nordstrom Rewards travel benefit into Nordstrom Notes during the
fourth quarter of 2013.
For further information on our quarterly results in 2013 and 2012, refer to Note 17: Selected Quarterly Data in the Notes to Consolidated
Financial Statements in Item 8: Financial Statements and Supplementary Data.
Table of Contents