Nordstrom 2013 Annual Report Download - page 61
Download and view the complete annual report
Please find page 61 of the 2013 Nordstrom annual report below. You can navigate through the pages in the report by either clicking on the pages listed below, or by using the keyword search tool below to find specific information within the annual report.-
 1
1 -
2
-
3
-
4
-
5
-
6
-
7
-
8
-
9
-
10
-
11
-
12
-
13
-
14
-
15
-
16
-
17
-
18
-
19
-
20
-
21
-
22
-
23
-
24
-
25
-
26
-
27
-
28
-
29
-
30
-
31
-
32
-
33
-
34
-
35
-
36
-
37
-
38
-
39
-
40
-
41
-
42
-
43
-
44
-
45
-
46
-
47
-
48
-
49
-
50
-
 51
51 -
 52
52 -
 53
53 -
 54
54 -
 55
55 -
 56
56 -
 57
57 -
 58
58 -
 59
59 -
 60
60 -
 61
61 -
 62
62 -
 63
63 -
 64
64 -
 65
65 -
 66
66 -
 67
67 -
 68
68 -
 69
69 -
 70
70 -
 71
71 -
72
-
73
-
74
 |
 |

Nordstrom, Inc. and subsidiaries 61
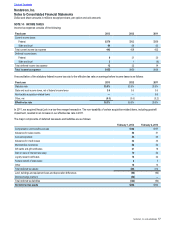
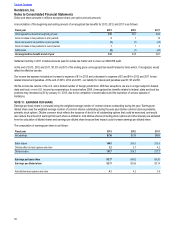
The following table summarizes net sales within our reportable segments:
Fiscal year 2013 2012 2011
Nordstrom full-line stores $7,705 $7,964 $7,513
Direct 1,622 1,269 913
Nordstrom 9,327 9,233 8,426
Nordstrom Rack 2,738 2,445 2,045
HauteLook and Jeffrey 330 271 185
Total Retail segment 12,395 11,949 10,656
Corporate/Other (229) (187) (159)
Total net sales $12,166 $11,762 $10,497
The following table summarizes net sales by merchandise category:
Fiscal year 2013 2012 2011
Net sales % of total Net sales % of total Net sales % of total
Women’s Apparel $3,733 31% $3,684 31% $3,438 33%
Shoes 2,828 23% 2,716 23% 2,413 23%
Men’s Apparel 1,943 16% 1,866 16% 1,612 15%
Women’s Accessories 1,644 14% 1,574 13% 1,311 12%
Cosmetics 1,312 11% 1,255 11% 1,106 11%
Kids’ Apparel 413 3% 381 3% 341 3%
Other 293 2% 286 3% 276 3%
Total net sales $12,166 100%$11,762 100% $10,497 100%
Table of Contents
Nordstrom, Inc.
Notes to Consolidated Financial Statements
Dollar and share amounts in millions except per share, per option and unit amounts