Nordstrom 2013 Annual Report Download - page 23
Download and view the complete annual report
Please find page 23 of the 2013 Nordstrom annual report below. You can navigate through the pages in the report by either clicking on the pages listed below, or by using the keyword search tool below to find specific information within the annual report.-
 1
1 -
2
-
3
-
4
-
5
-
6
-
7
-
8
-
9
-
10
-
11
-
12
-
 13
13 -
 14
14 -
 15
15 -
 16
16 -
 17
17 -
 18
18 -
 19
19 -
 20
20 -
 21
21 -
 22
22 -
 23
23 -
 24
24 -
 25
25 -
 26
26 -
 27
27 -
 28
28 -
 29
29 -
 30
30 -
 31
31 -
 32
32 -
 33
33 -
34
-
35
-
36
-
37
-
38
-
39
-
40
-
41
-
42
-
43
-
44
-
45
-
46
-
47
-
48
-
49
-
50
-
51
-
52
-
53
-
54
-
55
-
56
-
57
-
58
-
59
-
60
-
61
-
62
-
63
-
64
-
65
-
66
-
67
-
68
-
69
-
70
-
71
-
72
-
73
-
74
 |
 |

Nordstrom, Inc. and subsidiaries 23
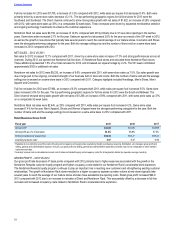
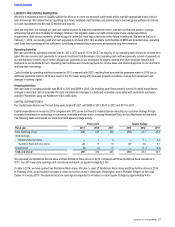
Income Tax Expense
Fiscal year 2013 2012 2011
Income tax expense $455 $450 $436
Effective tax rate 38.3% 38.0% 39.0%
The following table illustrates the components of our effective tax rate for 2013, 2012 and 2011:
Fiscal year 2013 2012 2011
Statutory rate 35.0% 35.0% 35.0%
State and local income taxes, net of federal income taxes 3.6 3.6 3.6
Non-taxable acquisition-related items ——0.6
Other, net (0.3) (0.6) (0.2)
Effective tax rate 38.3% 38.0% 39.0%
INCOME TAX EXPENSE – 2013 VS 2012
The increase in the effective tax rate for 2013 compared with 2012 was primarily due to changes in our estimated state tax reserves.
INCOME TAX EXPENSE – 2012 VS 2011
The decrease in the effective tax rate for 2012 compared with 2011 was primarily due to the impact of non-taxable HauteLook acquisition-
related expenses in 2011, including a goodwill impairment.
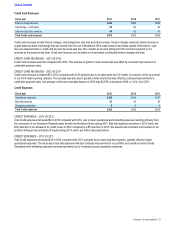
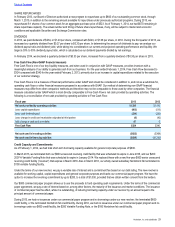
Fourth Quarter Results
Quarter ended February 1, 2014 February 2, 2013
Net sales $3,614 $3,596
Credit card revenues 97 102
Gross profit 1,345 1,357
Gross profit (% of net sales) 37.2% 37.8%
Retail SG&A expenses (918) (917)
Retail SG&A (% of net sales) (25.4%) (25.5%)
Credit expenses (38) (46)
Net earnings 268 284
Earnings per diluted share $1.37 $1.40
Nordstrom’s fourth quarter performance reflected the trends we saw throughout the year. We continued to make progress executing our
customer strategy through investments to drive growth across channels, while maintaining disciplined execution around inventory and
expenses. Net earnings for the fourth quarter of 2013 were $268, or $1.37 per diluted share, compared with $284, or $1.40 per diluted share,
in 2012. Earnings per diluted share for the fourth quarter of 2013 included $0.04 per diluted share of non-recurring expenses related to our
debt refinancing. Additionally, the 53rd week in 2012 contributed approximately $0.04 to earnings per diluted share.
Table of Contents