Nissan 2008 Annual Report Download - page 90
Download and view the complete annual report
Please find page 90 of the 2008 Nissan annual report below. You can navigate through the pages in the report by either clicking on the pages listed below, or by using the keyword search tool below to find specific information within the annual report.-
 1
1 -
2
-
3
-
4
-
5
-
6
-
7
-
8
-
9
-
10
-
11
-
12
-
13
-
14
-
15
-
16
-
17
-
18
-
19
-
20
-
21
-
22
-
23
-
24
-
25
-
26
-
27
-
28
-
29
-
30
-
31
-
32
-
33
-
34
-
35
-
36
-
37
-
38
-
39
-
40
-
41
-
42
-
43
-
44
-
45
-
46
-
47
-
48
-
49
-
50
-
51
-
52
-
53
-
54
-
55
-
56
-
57
-
58
-
59
-
60
-
61
-
62
-
63
-
64
-
65
-
66
-
67
-
68
-
69
-
70
-
71
-
72
-
73
-
74
-
75
-
76
-
77
-
78
-
79
-
 80
80 -
 81
81 -
 82
82 -
 83
83 -
 84
84 -
 85
85 -
 86
86 -
 87
87 -
 88
88 -
 89
89 -
 90
90 -
 91
91 -
 92
92 -
 93
93 -
 94
94 -
 95
95 -
 96
96 -
 97
97 -
 98
98 -
 99
99 -
 100
100 -
101
-
102
 |
 |

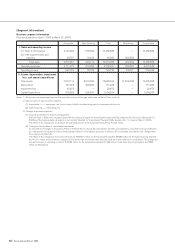
88 Nissan Annual Report 2008
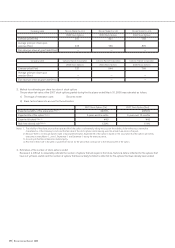
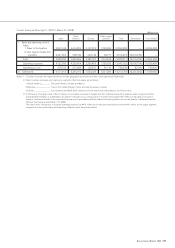
Prior fiscal year (from April 1, 2006 to March 31, 2007) (Millions of yen)
Other foreign
North America Europe countries Total
I. Overseas net sales 4,410,531 2,023,772 1,829,617 8,263,920
II. Consolidated net sales 10,468,583
III. Overseas net sales as a percentage
of consolidated net sales 42.1% 19.3% 17.5% 78.9%
Notes: 1. Overseas net sales include export sales of the Company and its domestic consolidated subsidiaries and sales (other than exports to Japan) of its foreign
consolidated subsidiaries.
2. Countries and areas are segmented based on their geographical proximity and their mutual operational relationship.
3. Major countries and areas which belong to segments other than Japan are as follows:
(1) North America......................... The United States, Canada, and Mexico
(2) Europe........................................... France, the United Kingdom, Spain and other European countries
(3) Other............................................... Asia, Oceania, the Middle East, Central and South America excluding Mexico, and South Africa
4. Change in accounting policies
Change of closing dates of consolidated subsidiaries
As described in “Changes in Accounting Policies,” effective the year ended March 31, 2007, 22 subsidiaries have been consolidated by using their financial
statements as of the parent’s fiscal year end which were prepared solely for consolidation purposes. In addition, 33 consolidated subsidiaries have changed
their fiscal year end to March 31.
This change brought increases in overseas net sales of ¥177,178 million for North America, ¥402,598 million for Europe and ¥138,990 million for Other
foreign countries, compared to the results that would have been obtained under the former method of consolidation.
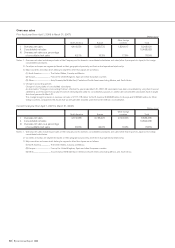
Current fiscal year (from April 1, 2007 to March 31, 2008) (Millions of yen)
Other foreign
North America Europe countries Total
I. Overseas net sales 4,319,665 2,168,427 2,148,343 8,636,435
II. Consolidated net sales 10,824,238
III. Overseas net sales as a percentage
of consolidated net sales 39.9% 20.0% 19.9% 79.8%
Notes: 1. Overseas net sales include export sales of the Company and its domestic consolidated subsidiaries and sales (other than exports to Japan) of its foreign
consolidated subsidiaries.
2. Countries and areas are segmented based on their geographical proximity and their mutual operational relationship.
3. Major countries and areas which belong to segments other than Japan are as follows:
(1) North America ......................... The United States, Canada, and Mexico
(2) Europe............................................ France, the United Kingdom, Spain and other European countries
(3) Other................................................ Asia, Oceania, the Middle East, Central and South America excluding Mexico, and South Africa
Overseas sales