Nissan 2008 Annual Report Download - page 46
Download and view the complete annual report
Please find page 46 of the 2008 Nissan annual report below. You can navigate through the pages in the report by either clicking on the pages listed below, or by using the keyword search tool below to find specific information within the annual report.-
 1
1 -
2
-
3
-
4
-
5
-
6
-
7
-
8
-
9
-
10
-
11
-
12
-
13
-
14
-
15
-
16
-
17
-
18
-
19
-
20
-
21
-
22
-
23
-
24
-
25
-
26
-
27
-
28
-
29
-
30
-
31
-
32
-
33
-
34
-
35
-
 36
36 -
 37
37 -
 38
38 -
 39
39 -
 40
40 -
 41
41 -
 42
42 -
 43
43 -
 44
44 -
 45
45 -
 46
46 -
 47
47 -
 48
48 -
 49
49 -
 50
50 -
 51
51 -
 52
52 -
 53
53 -
 54
54 -
 55
55 -
 56
56 -
57
-
58
-
59
-
60
-
61
-
62
-
63
-
64
-
65
-
66
-
67
-
68
-
69
-
70
-
71
-
72
-
73
-
74
-
75
-
76
-
77
-
78
-
79
-
80
-
81
-
82
-
83
-
84
-
85
-
86
-
87
-
88
-
89
-
90
-
91
-
92
-
93
-
94
-
95
-
96
-
97
-
98
-
99
-
100
-
101
-
102
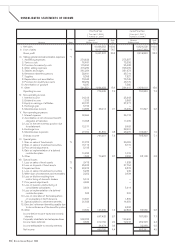
 |
 |
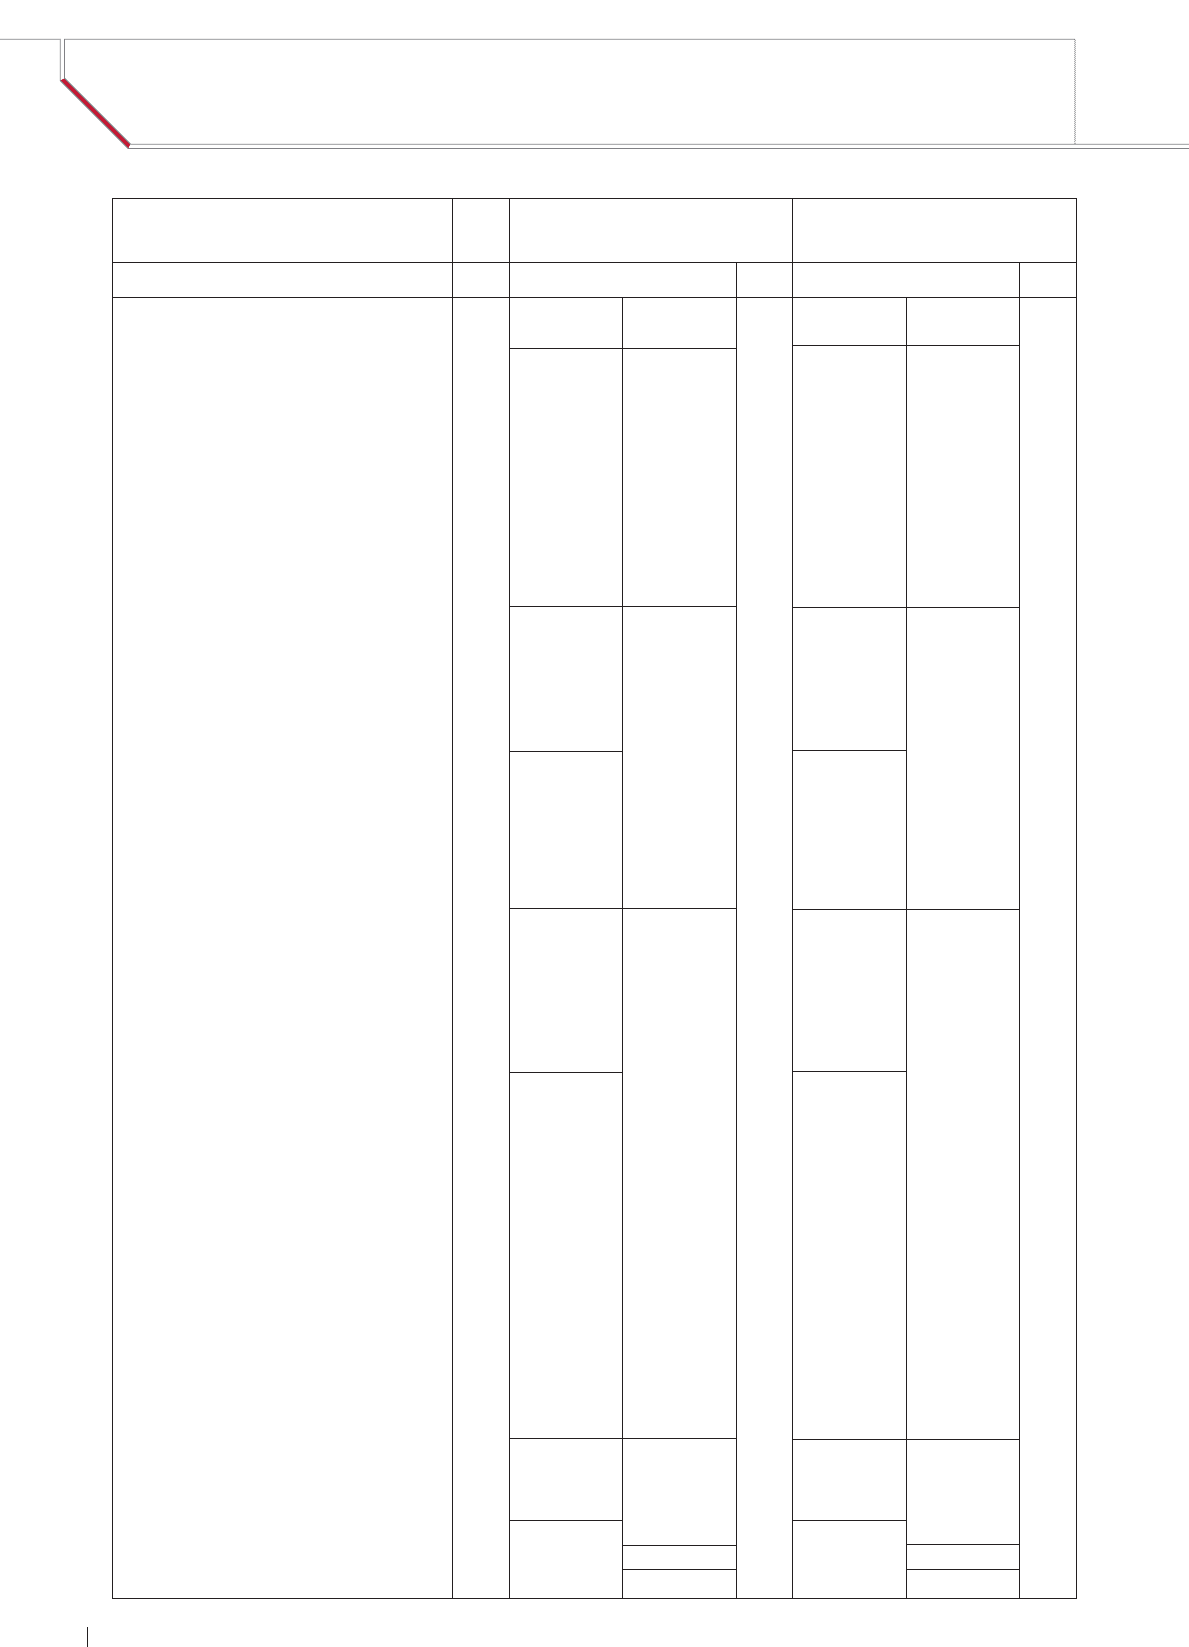
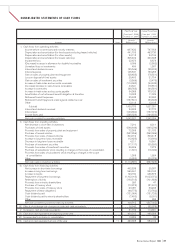
CONSOLIDATED STATEMENTS OF INCOME
44 Nissan Annual Report 2008
Prior Fiscal Year Current Fiscal
Year
From April 1, 2006 From April 1, 2007
[
To March 31, 2007
][
To March 31, 2008
]
Amounts Ratio Amounts Ratio
Accounts Notes (Millions of yen) (%) (Millions of yen) (%)
I. Net sales 10,468,583 100.0 10,824,238 100.0
II. Cost of sales *1 8,027,186 76.7 8,407,398 77.7
Gross profit 2,441,397 23.3 2,416,840 22.3
III. Selling, general and administrative expenses *1
1. Advertising expenses 274,833 275,857
2. Service costs 76,481 73,236
3. Provision for warranty costs 115,490 95,408
4. Other selling expenses 415,269 395,095
5. Salaries and wages 381,284 381,673
6. Retirement benefit expenses 33,491 35,719
7. Supplies 8,395 7,527
8. Depreciation and amortization 73,045 75,742
9. Provision for doubtful accounts 38,282 43,776
10. Amortization of goodwill 6,337 7,565
11. Other 241,551 1,664,458 15.9 234,412 1,626,010 15.0
Operating income 776,939 7.4 790,830 7.3
IV. Non-operating income
1. Interest income 24,313 25,343
2. Dividend income 1,233 2,862
3. Equity in earnings of affiliates 20,187 37,217
4. Exchange gain 5,796 —
5. Miscellaneous income 14,385 65,914 0.7 16,405 81,827 0.8
V. Non-operating expenses
1. Interest expense 30,664 36,118
2. Amortization of net retirement benefit
obligation at transition 10,928 11,009
3. Loss on the net monetary position due
to restatement 12,211 6,902
4. Exchange loss — 28,991
5. Miscellaneous expenses 27,999 81,802 0.8 23,237 106,257 1.0
Ordinary income 761,051 7.3 766,400 7.1
VI. Special gains
1. Gain on sales of fixed assets *2 31,973 80,089
2. Gain on sales of investment securities 15,714 3,715
3. Prior period adjustments 5,193 —
4. Gain on implementation of a defined
contribution plans 19,285 1,076
5. Other 1,522 73,687 0.7 3,258 88,138 0.8
VII. Special losses
1. Loss on sales of fixed assets *2 3,475 1,538
2. Loss on disposal of fixed assets 25,402 21,754
3. Impairment loss *3 22,673 8,878
4. Loss on sales of investment securities 6,234 240
5. Write-down of investments and receivables 2,252 2,934
6. Loss on dilution resulting from
restructuring of domestic dealers 5,914 —
7. Prior period adjustments 4,689 —
8. Loss on business restructuring of
consolidated subsidiaries 3,824 5,414
9. Loss on implementation of a defined
contribution plans 503 220
10. Loss on relocation of the headquarters
of a subsidiary in North America 10,827 1,895
11. Special addition to retirement benefits 31,933 14,350
12. Directors’ retirement benefits payable due
to discontinuance of the benefits system — 6,533
13. Other 19,580 137,306 1.3 22,824 86,580 0.8
Income before income taxes and minority
interests 697,432 6.7 767,958 7.1
Corporate, inhabitants’ and enterprise taxes 202,328 190,690
Income taxes deferred 9,834 212,162 2.0 72,018 262,708 2.4
Income attributable to minority interests 24,474 0.3 22,989 0.2
Net income 460,796 4.4 482,261 4.5