Nissan 2008 Annual Report Download - page 19
Download and view the complete annual report
Please find page 19 of the 2008 Nissan annual report below. You can navigate through the pages in the report by either clicking on the pages listed below, or by using the keyword search tool below to find specific information within the annual report.-
 1
1 -
2
-
3
-
4
-
5
-
6
-
7
-
8
-
 9
9 -
 10
10 -
 11
11 -
 12
12 -
 13
13 -
 14
14 -
 15
15 -
 16
16 -
 17
17 -
 18
18 -
 19
19 -
 20
20 -
 21
21 -
 22
22 -
 23
23 -
 24
24 -
 25
25 -
 26
26 -
 27
27 -
 28
28 -
 29
29 -
30
-
31
-
32
-
33
-
34
-
35
-
36
-
37
-
38
-
39
-
40
-
41
-
42
-
43
-
44
-
45
-
46
-
47
-
48
-
49
-
50
-
51
-
52
-
53
-
54
-
55
-
56
-
57
-
58
-
59
-
60
-
61
-
62
-
63
-
64
-
65
-
66
-
67
-
68
-
69
-
70
-
71
-
72
-
73
-
74
-
75
-
76
-
77
-
78
-
79
-
80
-
81
-
82
-
83
-
84
-
85
-
86
-
87
-
88
-
89
-
90
-
91
-
92
-
93
-
94
-
95
-
96
-
97
-
98
-
99
-
100
-
101
-
102
 |
 |

17
Nissan Annual Report 2008
PERFORMANCE
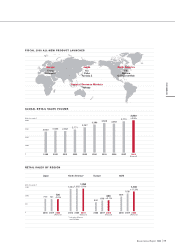
FISCAL 2008 ALL-NEW PRODUCT LAUNCHES
4,000
0
3,000
2,000
1,000
(Units: thousands)
1,500
1,000
500
0
(Units: thousands)
RETAIL SALES BY REGION
GLOBAL RETAIL SALES VOLUME
Japan North America* Europe GOM
Japan
Kix
Cube
Fairlady Z
Europe
Teana
Qashqai+2
General Overseas Markets
NP200
North America
FX
Maxima
G37 Convertible
2000 2001 2002 20031999 2004 2008
(Forecast)
2005 2006 2007
2007 2008
(Forecast)
2006 2007 2008
(Forecast)
20062007 2008
(Forecast)
20062007 2008
(Forecast)
2006
2,633 2,597 2,771 3,057
2,530
3,389
3,900
+3.5%
3,569 3,483 3,770
1,352 1,350
-0.1%
1,334
1,061
1,180
+11.3%
869
636 650
+2.1%
540
721 720
-0.2%
740
* Including Mexico
and Canada