Nissan 2008 Annual Report Download - page 88
Download and view the complete annual report
Please find page 88 of the 2008 Nissan annual report below. You can navigate through the pages in the report by either clicking on the pages listed below, or by using the keyword search tool below to find specific information within the annual report.-
 1
1 -
2
-
3
-
4
-
5
-
6
-
7
-
8
-
9
-
10
-
11
-
12
-
13
-
14
-
15
-
16
-
17
-
18
-
19
-
20
-
21
-
22
-
23
-
24
-
25
-
26
-
27
-
28
-
29
-
30
-
31
-
32
-
33
-
34
-
35
-
36
-
37
-
38
-
39
-
40
-
41
-
42
-
43
-
44
-
45
-
46
-
47
-
48
-
49
-
50
-
51
-
52
-
53
-
54
-
55
-
56
-
57
-
58
-
59
-
60
-
61
-
62
-
63
-
64
-
65
-
66
-
67
-
68
-
69
-
70
-
71
-
72
-
73
-
74
-
75
-
76
-
77
-
 78
78 -
 79
79 -
 80
80 -
 81
81 -
 82
82 -
 83
83 -
 84
84 -
 85
85 -
 86
86 -
 87
87 -
 88
88 -
 89
89 -
 90
90 -
 91
91 -
 92
92 -
 93
93 -
 94
94 -
 95
95 -
 96
96 -
 97
97 -
 98
98 -
99
-
100
-
101
-
102
 |
 |

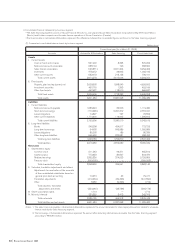
86 Nissan Annual Report 2008
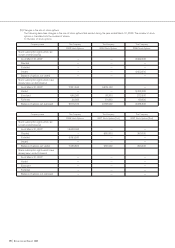
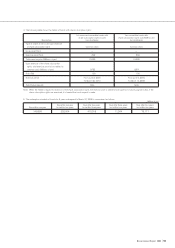
Prior fiscal year (from April 1, 2006 to March 31, 2007) (Millions of yen)
North Other foreign
Japan America Europe countries Total Eliminations Consolidated
I. Sales and operating income:
Sales:
1. Sales to third parties 2,478,549 4,550,498 2,038,026 1,401,510 10,468,583 — 10,468,583
2. Inter-segment sales and
transfers 2,205,469 138,945 128,388 27,528 2,500,330 (2,500,330) —
Total 4,684,018 4,689,443 2,166,414 1,429,038 12,968,913 (2,500,330) 10,468,583
Operating expenses 4,411,824 4,329,427 2,084,112 1,370,801 12,196,164 (2,504,520) 9,691,644
Operating income 272,194 360,016 82,302 58,237 772,749 4,190 776,939
II. Total assets 6,031,316 6,085,485 1,482,333 1,070,801 14,669,935 (2,267,727) 12,402,208
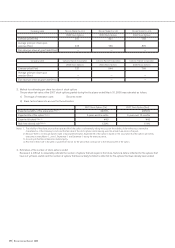
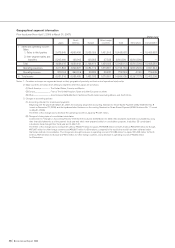
Notes: 1. Countries and areas are segmented based on their geographical proximity and their mutual operational relationship.
2. Major countries and areas which belong to segments other than Japan are as follows:
(1) North America ......................... The United States, Canada, and Mexico
(2) Europe............................................ France, The United Kingdom, Spain and other European countries
(3) Other................................................ Asia, Oceania, the Middle East, Central and South America excluding Mexico, and South Africa
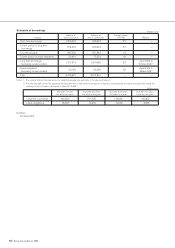
3. Changes in accounting policies
(1) Accounting standard for share-based payments
Beginning with the year ended March 31, 2007, the Company adopts the Accounting Standard for Share-Based Payment (ASBJ Statement No. 8
issued on December 27, 2005) and the Implementation Guidance on Accounting Standard for Share-Based Payment (ASBJ Guidance No. 11 issued
on May 31, 2006).
The effect of this change was to decrease the operating income for Japan by ¥1,037 million.
(2) Change of closing dates of consolidated subsidiaries
As described in “Changes in Accounting Policies,” effective the fiscal year ended March 31, 2007, 22 subsidiaries have been consolidated by using
their financial statements as of the parent’s fiscal year end which were prepared solely for consolidation purposes. In addition, 33 consolidated
subsidiaries have changed their fiscal year end to March 31.
The effect of this change was to increase net sales by ¥62,479 million for Japan, ¥219,878 million for North America, ¥454,769 million for Europe,
¥87,087 million for other foreign countries and ¥56,607 million for Eliminations, compared to the results that would have been obtained under
the former method of consolidation. This change also brought increases in operating income of ¥1,586 million for Japan, ¥21,403 million for North
America, ¥2,744 million for Europe and ¥210 million for other foreign countries, and a decrease in operating income of ¥4,500 million
for Eliminations.
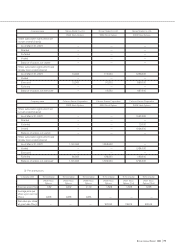
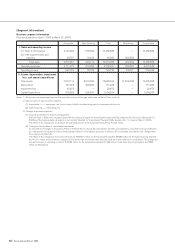
Geographical segment information