Nissan 2008 Annual Report Download - page 15
Download and view the complete annual report
Please find page 15 of the 2008 Nissan annual report below. You can navigate through the pages in the report by either clicking on the pages listed below, or by using the keyword search tool below to find specific information within the annual report.-
 1
1 -
2
-
3
-
4
-
 5
5 -
 6
6 -
 7
7 -
 8
8 -
 9
9 -
 10
10 -
 11
11 -
 12
12 -
 13
13 -
 14
14 -
 15
15 -
 16
16 -
 17
17 -
 18
18 -
 19
19 -
 20
20 -
 21
21 -
 22
22 -
 23
23 -
 24
24 -
 25
25 -
26
-
27
-
28
-
29
-
30
-
31
-
32
-
33
-
34
-
35
-
36
-
37
-
38
-
39
-
40
-
41
-
42
-
43
-
44
-
45
-
46
-
47
-
48
-
49
-
50
-
51
-
52
-
53
-
54
-
55
-
56
-
57
-
58
-
59
-
60
-
61
-
62
-
63
-
64
-
65
-
66
-
67
-
68
-
69
-
70
-
71
-
72
-
73
-
74
-
75
-
76
-
77
-
78
-
79
-
80
-
81
-
82
-
83
-
84
-
85
-
86
-
87
-
88
-
89
-
90
-
91
-
92
-
93
-
94
-
95
-
96
-
97
-
98
-
99
-
100
-
101
-
102
 |
 |

13
Nissan Annual Report 2008
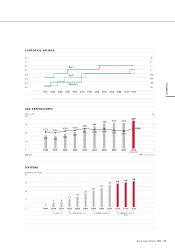
PERFORMANCE
(Billions of yen)
(Billions of yen)
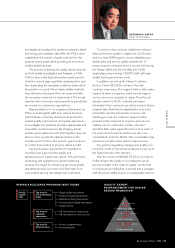
NET CASH FLOW (AUTO)
IMPACT ON OPERATING PROFIT
* Unaudited
Product
enrich./
regulatory
cost
Selling
expenses G&A
& others FOREXPurch.
cost
reduction
Price/
volume mix Warranty
expenses Raw
material
/energy
cost
FY06
O.P.
No Gap*
(same month
as FY07)
Mfg.
expenses R&D
expenses FY07
O.P.
-52.2
-38.1 -18.0 -16.2
+172.9
+75.0 +7.6 -84.7
755.2
-9.2 -1.5 790.8
Tax paidSales
finance
receivables
Working
capital and
others
Net auto
cash at
beginning
of FY07
Net cash
from
operations
CAPEX and
others Dividends
paid Treasury
stock Other
finance
activities
FX rate
impact Net auto
cash at end
of FY07
-154.0
-72.6
-1.6
254.7
+1,110.1
-425.2
-151.7
-48.1 -133.7
-197.6
180.3
Free cash flow
456.7
Financing activities
-333.5
FINANCIAL POSITION
Balance sheet
In fiscal 2007, Nissan’s total consolidated assets
decreased 3.7 percent to ¥11,939.5 billion. Current
assets decreased 3.1 percent to ¥6,294.2 billion.
The main reason was a ¥322.8 billion decrease in
finance receivables, which was offset by a ¥112.3
billion increase in cash on hand and in banks. Fixed
assets decreased to ¥5,645.3 billion, representing a
4.5 percent decline.
Current liabilities decreased 6.0 percent to
¥5,242.6 billion, the result of a ¥340.4 billion
decrease in short-term borrowing. Total long-term
liabilities decreased 3.5 percent to ¥2,847.4 billion,
mainly the result of a ¥116.9 billion decrease in
long-term borrowing.
Net assets decreased 0.7 percent to ¥3,849.4
billion, compared to ¥3,877.0 billion in fiscal 2006.
This was mainly due to changes of ¥332.6 billion
in foreign currency translation adjustments and
¥151.7 billion in dividends paid, which were offset
by the ¥482.3 billion of increased net income
mentioned above.