Nissan 2008 Annual Report Download - page 81
Download and view the complete annual report
Please find page 81 of the 2008 Nissan annual report below. You can navigate through the pages in the report by either clicking on the pages listed below, or by using the keyword search tool below to find specific information within the annual report.-
 1
1 -
2
-
3
-
4
-
5
-
6
-
7
-
8
-
9
-
10
-
11
-
12
-
13
-
14
-
15
-
16
-
17
-
18
-
19
-
20
-
21
-
22
-
23
-
24
-
25
-
26
-
27
-
28
-
29
-
30
-
31
-
32
-
33
-
34
-
35
-
36
-
37
-
38
-
39
-
40
-
41
-
42
-
43
-
44
-
45
-
46
-
47
-
48
-
49
-
50
-
51
-
52
-
53
-
54
-
55
-
56
-
57
-
58
-
59
-
60
-
61
-
62
-
63
-
64
-
65
-
66
-
67
-
68
-
69
-
70
-
 71
71 -
 72
72 -
 73
73 -
 74
74 -
 75
75 -
 76
76 -
 77
77 -
 78
78 -
 79
79 -
 80
80 -
 81
81 -
 82
82 -
 83
83 -
 84
84 -
 85
85 -
 86
86 -
 87
87 -
 88
88 -
 89
89 -
 90
90 -
 91
91 -
92
-
93
-
94
-
95
-
96
-
97
-
98
-
99
-
100
-
101
-
102
 |
 |

79
Nissan Annual Report 2008
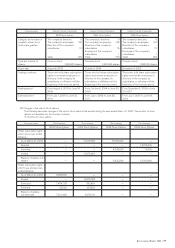
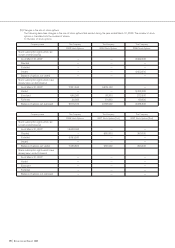
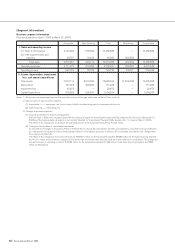
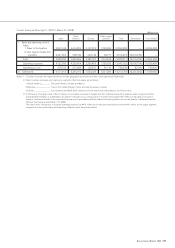
1. Significant components of deferred tax assets and liabilities
Prior fiscal year Current fiscal year
(As of March 31, 2007) (As of March 31, 2008)
Deferred tax assets:
Net operating loss carry forwards ¥ 56,141 ¥ 54,802
Accrued retirement benefits 128,515 102,744
Accrued warranty costs 70,364 62,511
Other 499,960 460,939
Total gross deferred tax assets 754,980 680,996
Valuation allowance (72,601) (83,519)
Total deferred tax assets 682,379 597,477
Deferred tax liabilities:
Reserves under Special Taxation Measures Law, etc. (451,404) (401,535)
Difference between cost of investments and their underlying net equity
at fair value (78,917) (79,241)
Unrealized holding gain on securities (4,166) (4,562)
Other (182,082) (181,706)
Total deferred tax liabilities (716,569) (667,044)
Net deferred tax assets ¥ (34,190) ¥ (69,567)
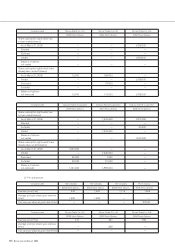
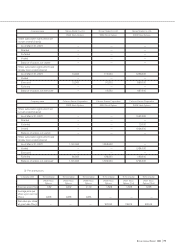
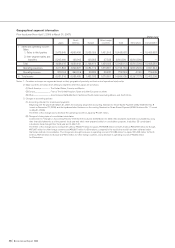
Note: Net deferred tax assets as of March 31, 2007 and 2008 are reflected in the following accounts in the consolidated balance sheets:
Prior fiscal year Current fiscal year
(As of March 31, 2007) (As of March 31, 2008)
(Millions of yen)
Current assets—deferred tax assets ¥ 324,979 ¥ 299,306
Fixed assets—deferred tax assets 157,495 94,420
Current liabilities—deferred tax liabilities 9,064 1,501
Long-term liabilities—deferred tax liabilities 507,600 461,792
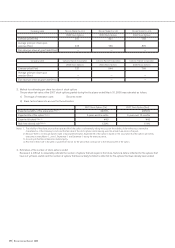
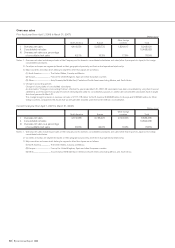
2. The reconciliation between the effective tax rates reflected in the consolidated financial statements and the statutory tax rate is summarized
as follows:
Prior fiscal year Current fiscal year
(As of March 31, 2007) (As of March 31, 2008)
Statutory tax rate of the Company 40.6% 40.6%
(Reconciliation)
• Different tax rates applied to foreign subsidiaries (5.4)% (5.9)%
• Tax credits (2.8)% (1.6)%
• Change in valuation allowance (0.0)% 1.6%
• Equity in earnings of affiliates (1.2)% (2.0)%
• Other (0.8)% 1.5%
Effective tax rates after adoption of tax-effect accounting 30.4% 34.2%
(For income taxes)
(Millions of yen)