Nissan 2008 Annual Report Download - page 84
Download and view the complete annual report
Please find page 84 of the 2008 Nissan annual report below. You can navigate through the pages in the report by either clicking on the pages listed below, or by using the keyword search tool below to find specific information within the annual report.-
 1
1 -
2
-
3
-
4
-
5
-
6
-
7
-
8
-
9
-
10
-
11
-
12
-
13
-
14
-
15
-
16
-
17
-
18
-
19
-
20
-
21
-
22
-
23
-
24
-
25
-
26
-
27
-
28
-
29
-
30
-
31
-
32
-
33
-
34
-
35
-
36
-
37
-
38
-
39
-
40
-
41
-
42
-
43
-
44
-
45
-
46
-
47
-
48
-
49
-
50
-
51
-
52
-
53
-
54
-
55
-
56
-
57
-
58
-
59
-
60
-
61
-
62
-
63
-
64
-
65
-
66
-
67
-
68
-
69
-
70
-
71
-
72
-
73
-
 74
74 -
 75
75 -
 76
76 -
 77
77 -
 78
78 -
 79
79 -
 80
80 -
 81
81 -
 82
82 -
 83
83 -
 84
84 -
 85
85 -
 86
86 -
 87
87 -
 88
88 -
 89
89 -
 90
90 -
 91
91 -
 92
92 -
 93
93 -
 94
94 -
95
-
96
-
97
-
98
-
99
-
100
-
101
-
102
 |
 |
82 Nissan Annual Report 2008
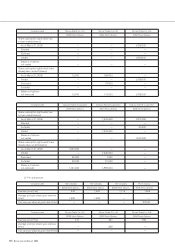
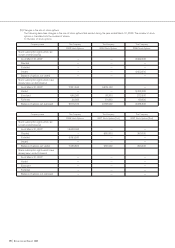
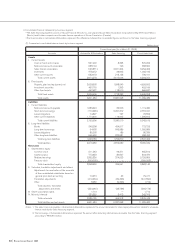
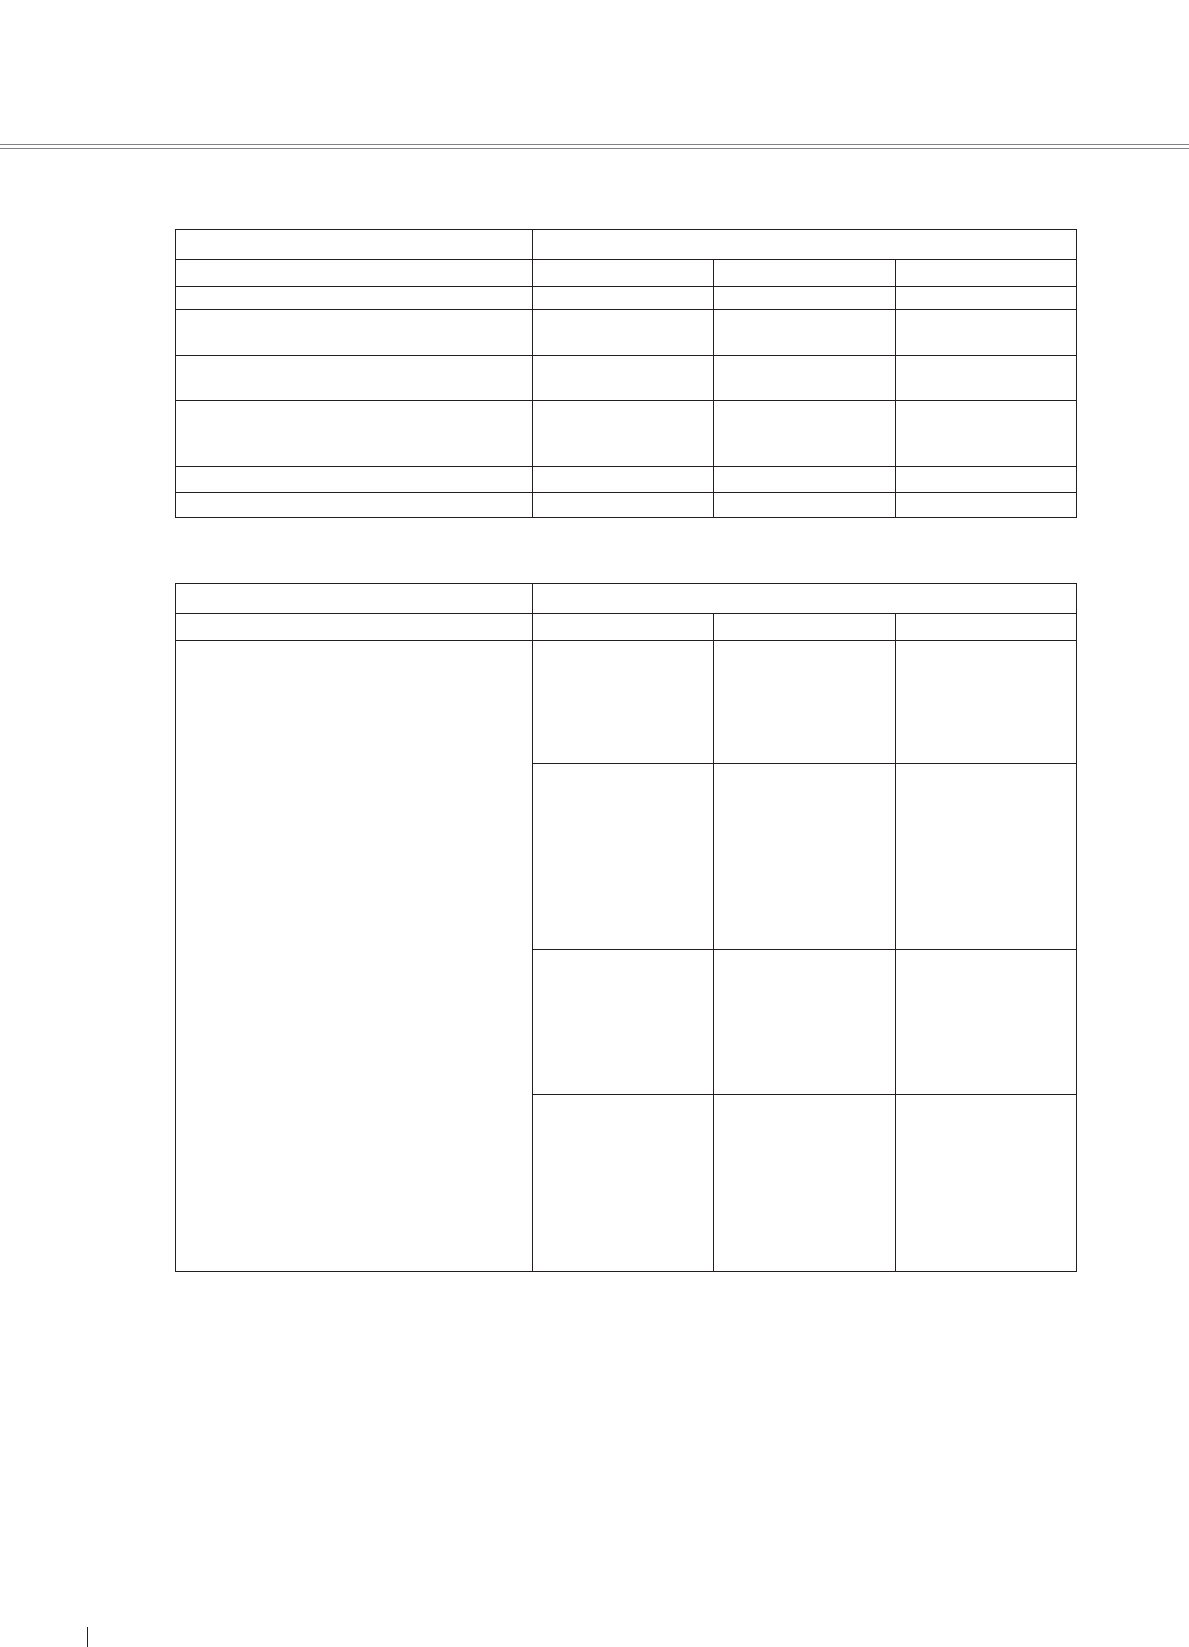
(2) Summarized consolidated statements of income by business segment (Millions of yen)
Prior fiscal year (From April 1, 2006 to March 31, 2007)
Accounts Automobile & Eliminations Sales financing Consolidated total
Net sales 9,773,871 694,712 10,468,583
Cost of sales 7,498,350 528,836 8,027,186
Gross profit 2,275,521 165,876 2,441,397
Operating income as a percentage of net sales 7.2% 10.9% 7.4%
Operating income 701,186 75,753 776,939
Financial income/expenses—net (5,664) 546 (5,118)
Other non-operating income/expenses—net (11,520) 750 (10,770)
Ordinary income 684,002 77,049 761,051
Income before income taxes and minority interests 621,236 76,196 697,432
Net income 413,529 47,267 460,796
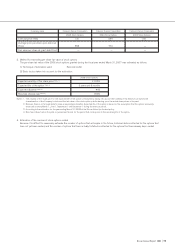
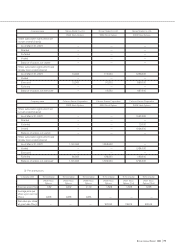
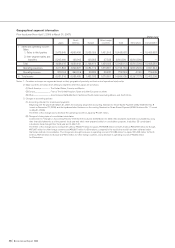
(3) Summarized consolidated statements of cash flows by business segment (Millions of yen)
Prior fiscal year (From April 1, 2006 to March 31, 2007)
Accounts Automobile & Eliminations Sales financing Consolidated total
I. Cash flows from operating activities
Income before income taxes and minority
interests 621,236 76,196 697,432
Depreciation and amortization 447,924 323,299 771,223
Decrease (increase) in finance receivables (22,914) 67,255 44,341
Others (528,386) 58,217 (470,169)
Net cash provided by operating activities 517,860 524,967 1,042,827
II. Cash flows from investing activities
Proceeds from sales of investment securities 37,794 — 37,794
Proceeds from sales of property, plant and
equipment 72,308 0 72,308
Purchases of fixed assets (537,129) (9,719) (546,848)
Purchases of leased vehicles (41,234) (916,122) (957,356)
Proceeds from sales of leased vehicles 7,253 297,659 304,912
Others (35,804) 10,407 (25,397)
Net cash used in investing activities (496,812) (617,775) (1,114,587)
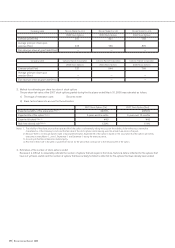
III. Cash flows from financing activities
Net increase in short-term borrowings 418,824 73,714 492,538
Net change in long-term borrowings and
redemption of bonds (215,299) (107,770) (323,069)
Increase in bonds — 123,730 123,730
Others (186,460) 173 (186,287)
Net cash provided by financing activities 17,065 89,847 106,912
IV. Effect of exchange rate changes on cash and
cash equivalents 16,775 (135) 16,640
V. Increase (decrease) in cash and cash equivalents 54,888 (3,096) 51,792
VI. Cash and cash equivalents at beginning of the year 392,505 11,707 404,212
VII. Increase due to inclusion in consolidation 12,571 813 13,384
VIII.Cash and cash equivalents at end of the year 459,964 9,424 469,388
Notes 1. The net increase in short-term borrowings of Automobile & Eliminations includes the amount of ¥16,522 million eliminated for increase in
internal loans receivable from the Sales financing segment.
2. The net change in long-term borrowings and redemption of bonds of Automobile & Eliminations includes the amount of ¥25,073 million
eliminated for increase in internal loans receivable from the Sales financing segment.