Nissan 2008 Annual Report Download - page 83
Download and view the complete annual report
Please find page 83 of the 2008 Nissan annual report below. You can navigate through the pages in the report by either clicking on the pages listed below, or by using the keyword search tool below to find specific information within the annual report.-
 1
1 -
2
-
3
-
4
-
5
-
6
-
7
-
8
-
9
-
10
-
11
-
12
-
13
-
14
-
15
-
16
-
17
-
18
-
19
-
20
-
21
-
22
-
23
-
24
-
25
-
26
-
27
-
28
-
29
-
30
-
31
-
32
-
33
-
34
-
35
-
36
-
37
-
38
-
39
-
40
-
41
-
42
-
43
-
44
-
45
-
46
-
47
-
48
-
49
-
50
-
51
-
52
-
53
-
54
-
55
-
56
-
57
-
58
-
59
-
60
-
61
-
62
-
63
-
64
-
65
-
66
-
67
-
68
-
69
-
70
-
71
-
72
-
 73
73 -
 74
74 -
 75
75 -
 76
76 -
 77
77 -
 78
78 -
 79
79 -
 80
80 -
 81
81 -
 82
82 -
 83
83 -
 84
84 -
 85
85 -
 86
86 -
 87
87 -
 88
88 -
 89
89 -
 90
90 -
 91
91 -
 92
92 -
 93
93 -
94
-
95
-
96
-
97
-
98
-
99
-
100
-
101
-
102
 |
 |

81
Nissan Annual Report 2008
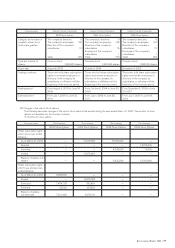
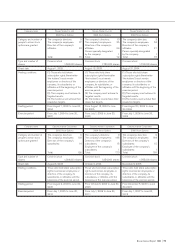
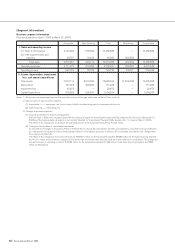
4. Consolidated financial statements by business segment
• The sales financing segment consists of Nissan Financial Services Co., Ltd. (Japan), Nissan Motor Acceptance Corporation (USA), NR Finance Mexico
(Mexico), NR Wholesale Mexico (Mexico), ESARA, S.A. De C.V. (Mexico), Nissan Leasing (Thailand) Co., Ltd. (Thailand) and the sales finance operations
of Nissan Canada Inc. (Canada).
• The financial data on Automobile & Eliminations represent the differences between the consolidated figures and those for the Sales Financing segment.
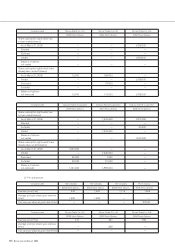
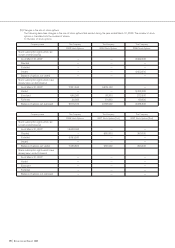
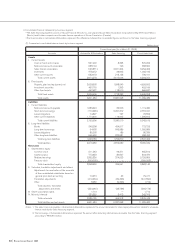
(1) Summarized consolidated balance sheets by business segment (Millions of yen)
Prior fiscal year (As of March 31, 2007)
Accounts Automobile & Eliminations Sales financing Consolidated total
Assets
I. Current assets
Cash on hand and in banks 450,916 7,009 457,925
Notes and accounts receivable 679,087 32 679,119
Sales finance receivables (209,718) 3,766,941 3,557,223
Inventories 986,150 18,521 1,004,671
Other current assets 588,138 205,810 793,948
Total current assets 2,494,573 3,998,313 6,492,886
II. Fixed assets
Property, plant and equipment, net 3,097,369 1,779,819 4,877,188
Investment securities 384,337 1,875 386,212
Other fixed assets 515,549 130,373 645,922
Total fixed assets 3,997,255 1,912,067 5,909,322
Total assets 6,491,828 5,910,380 12,402,208
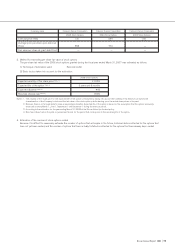
Liabilities
I. Current liabilities
Notes and accounts payable 1,076,607 26,579 1,103,186
Short-term borrowings (295,103) 3,392,514 3,097,411
Lease obligations 49,819 602 50,421
Other current liabilities 1,187,862 136,439 1,324,301
Total current liabilities 2,019,185 3,556,134 5,575,319
II. Long-term liabilities
Bonds 349,689 380,018 729,707
Long-term borrowings 39,863 1,127,951 1,167,814
Lease obligations 59,140 — 59,140
Other long-term liabilities 612,435 380,799 993,234
Total long-term liabilities 1,061,127 1,888,768 2,949,895
Total liabilities 3,080,312 5,444,902 8,525,214
Net assets
I. Shareholders’ equity
Common stock 513,167 92,647 605,814
Capital surplus 773,623 30,847 804,470
Retained earnings 2,092,036 310,690 2,402,726
Treasury stock (226,394) — (226,394)
Total shareholders’ equity 3,152,432 434,184 3,586,616
II. Valuation, translation adjustments and others
Adjustments for revaluation of the accounts
of the consolidated subsidiaries based on
general price level accounting 68,887 36 68,923
Translation adjustments (137,380) 28,166 (109,214)
Other (1,486) 398 (1,088)
Total valuation, translation
adjustments and others (69,979) 28,600 (41,379)
III. Share subscription rights 2,711 — 2,711
IV. Minority interests 326,352 2,694 329,046
Total net assets 3,411,516 465,478 3,876,994
Total liabilities and net assets 6,491,828 5,910,380 12,402,208
Notes: 1. The sales finance receivables of Automobile & Eliminations represents the amount eliminated for intercompany transactions related to wholesale
finance made by the Sales financing segment.
2. The borrowings of Automobile & Eliminations represent the amount after deducting internal loans receivable from the Sales financing segment
amounting to ¥1,013,908 million.