Nissan 2008 Annual Report Download - page 59
Download and view the complete annual report
Please find page 59 of the 2008 Nissan annual report below. You can navigate through the pages in the report by either clicking on the pages listed below, or by using the keyword search tool below to find specific information within the annual report.-
 1
1 -
2
-
3
-
4
-
5
-
6
-
7
-
8
-
9
-
10
-
11
-
12
-
13
-
14
-
15
-
16
-
17
-
18
-
19
-
20
-
21
-
22
-
23
-
24
-
25
-
26
-
27
-
28
-
29
-
30
-
31
-
32
-
33
-
34
-
35
-
36
-
37
-
38
-
39
-
40
-
41
-
42
-
43
-
44
-
45
-
46
-
47
-
48
-
 49
49 -
 50
50 -
 51
51 -
 52
52 -
 53
53 -
 54
54 -
 55
55 -
 56
56 -
 57
57 -
 58
58 -
 59
59 -
 60
60 -
 61
61 -
 62
62 -
 63
63 -
 64
64 -
 65
65 -
 66
66 -
 67
67 -
 68
68 -
 69
69 -
70
-
71
-
72
-
73
-
74
-
75
-
76
-
77
-
78
-
79
-
80
-
81
-
82
-
83
-
84
-
85
-
86
-
87
-
88
-
89
-
90
-
91
-
92
-
93
-
94
-
95
-
96
-
97
-
98
-
99
-
100
-
101
-
102
 |
 |
57
Nissan Annual Report 2008
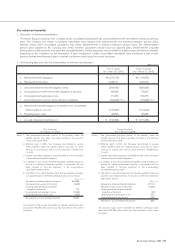
Prior fiscal year Current fiscal year
From April 1, 2006 From April 1, 2007
[
To March 31, 2007
][
To March 31, 2008
]
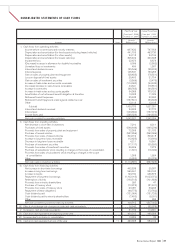
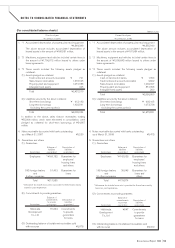
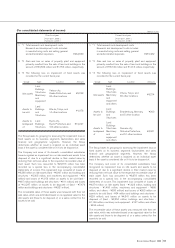
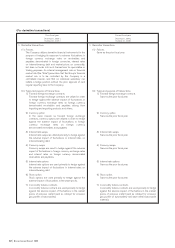
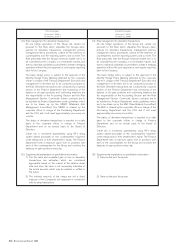
1. *1 Total research and development costs
Research and development costs included
in manufacturing costs and selling, general
and administrative expenses ¥464,839
2. *2 Gain and loss on sales of property, plant and equipment
primarily resulted from the sale of land and buildings in the
amount of ¥30,536 million and ¥1,753 million, respectively.
3. *3 The following loss on impairment of fixed assets was
recorded for the current fiscal year.
Usage Type Location Amount
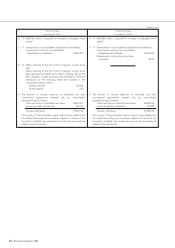
The Group bases its grouping for assessing the impairment loss on
fixed assets on its business segments (automobiles and sales
finance) and geographical segments. However, the Group
determines whether an asset is impaired on an individual asset
basis if the asset is considered idle or if it is to be disposed of.
The Company and some of its domestic consolidated subsidiaries
have recognized an impairment loss on idle assets and assets to be
disposed of due to a significant decline in their market value by
reducing their net book value to the respective recoverable value of
each asset. Such loss amounted to ¥22,673 million has been
recorded as a special loss in the accompanying consolidated
statements of income. This impairment loss consisted of losses of
¥9,298 million on idle assets (land - ¥6,907 million and building and
structures - ¥2,305 million, and machinery and equipment - ¥86
million) and losses of ¥1,078 million on assets to be sold (land -
¥467 million and buildings and structures - ¥611 million), and losses
of ¥12,297 million on assets to be disposed of (land - ¥7,476
million and buildings and structures - ¥4,821 million).
The recoverable value of these assets was measured with their net
sale value, which was estimated based on an appraisal value for the
idle assets and those to be disposed of, or a sales contract for the
assets to be sold.
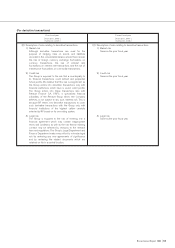
1. *1 Total research and development costs
Research and development costs included
in manufacturing costs and selling, general
and administrative expenses ¥457,482
2. *2 Gain and loss on sales of property, plant and equipment
primarily resulted from the sale of land and buildings in the
amount of ¥78,742 million and ¥1,013 million, respectively.
3. *3 The following loss on impairment of fixed assets was
recorded for the current fiscal year.
Usage Type Location Amount
The Group bases its grouping for assessing the impairment loss on
fixed assets on its business segments (automobiles and sales
finance) and geographical segments. However, the Group
determines whether an asset is impaired on an individual asset
basis if the asset is considered idle or if it is to be disposed of.
The Company and some of its consolidated subsidiaries have
recognized an impairment loss on idle assets and assets to be
disposed of due to a significant decline in their market value by
reducing their net book value to the respective recoverable value of
each asset. Such loss amounted to ¥8,878 million has been
recorded as a special loss in the accompanying consolidated
statements of income. This impairment loss consisted of losses of
¥4,274 million on idle assets (land - ¥1,628 million, building and
structures - ¥1,450 million, machinery and equipment - ¥666
million, and others - ¥530 million) and losses of ¥263 million on
assets to be sold (land - ¥34 million and buildings and structures -
¥229 million), and losses of ¥4,341 million on assets to be
disposed of (land - ¥2,554 million, buildings and structures -
¥1,146 million, machinery and equipment - ¥147 million, and others
- ¥494 million).
The recoverable value of these assets was measured with their net
sale value, which was estimated based on an appraisal value for the
idle assets and those to be disposed of, or a sales contract for the
assets to be sold.
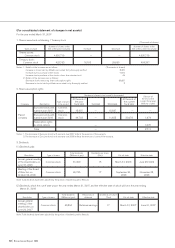
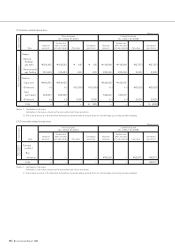
(Millions of yen)
Idle assets
Land
Buildings
Structures
Machinery
and
equipment
Assets to
be sold
Land
Buildings
and
Structures
Assets to
be disposed
of
Land
Buildings
Structures
Yatsuo-city,
Osaka Prefecture, and ¥9,298
93 other locations
Kita-ku, Tokyo, and ¥1,078
14 other locations
Kyoto-city,
Kyoto Prefecture, and ¥12,297
106 other locations
Idle assets
Land
Buildings
Structures
Machinery
and
equipment
and others
Assets to
be sold
Land
Buildings
and
Structures
Assets to
be disposed
of
Land
Buildings
Structures
Machinery
and
equipment
and others
Ota-ku, Tokyo, and ¥4,274
65 other locations
Brandenburg, Germany, ¥263
and 5 other location
Numazu-city,
Shizuoka Prefecture, ¥4,341
and 51 other locations
(For consolidated statements of income)