Nissan 2008 Annual Report Download - page 87
Download and view the complete annual report
Please find page 87 of the 2008 Nissan annual report below. You can navigate through the pages in the report by either clicking on the pages listed below, or by using the keyword search tool below to find specific information within the annual report.-
 1
1 -
2
-
3
-
4
-
5
-
6
-
7
-
8
-
9
-
10
-
11
-
12
-
13
-
14
-
15
-
16
-
17
-
18
-
19
-
20
-
21
-
22
-
23
-
24
-
25
-
26
-
27
-
28
-
29
-
30
-
31
-
32
-
33
-
34
-
35
-
36
-
37
-
38
-
39
-
40
-
41
-
42
-
43
-
44
-
45
-
46
-
47
-
48
-
49
-
50
-
51
-
52
-
53
-
54
-
55
-
56
-
57
-
58
-
59
-
60
-
61
-
62
-
63
-
64
-
65
-
66
-
67
-
68
-
69
-
70
-
71
-
72
-
73
-
74
-
75
-
76
-
 77
77 -
 78
78 -
 79
79 -
 80
80 -
 81
81 -
 82
82 -
 83
83 -
 84
84 -
 85
85 -
 86
86 -
 87
87 -
 88
88 -
 89
89 -
 90
90 -
 91
91 -
 92
92 -
 93
93 -
 94
94 -
 95
95 -
 96
96 -
 97
97 -
98
-
99
-
100
-
101
-
102
 |
 |
85
Nissan Annual Report 2008
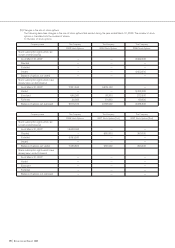
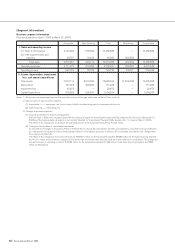
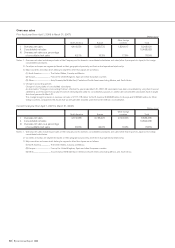
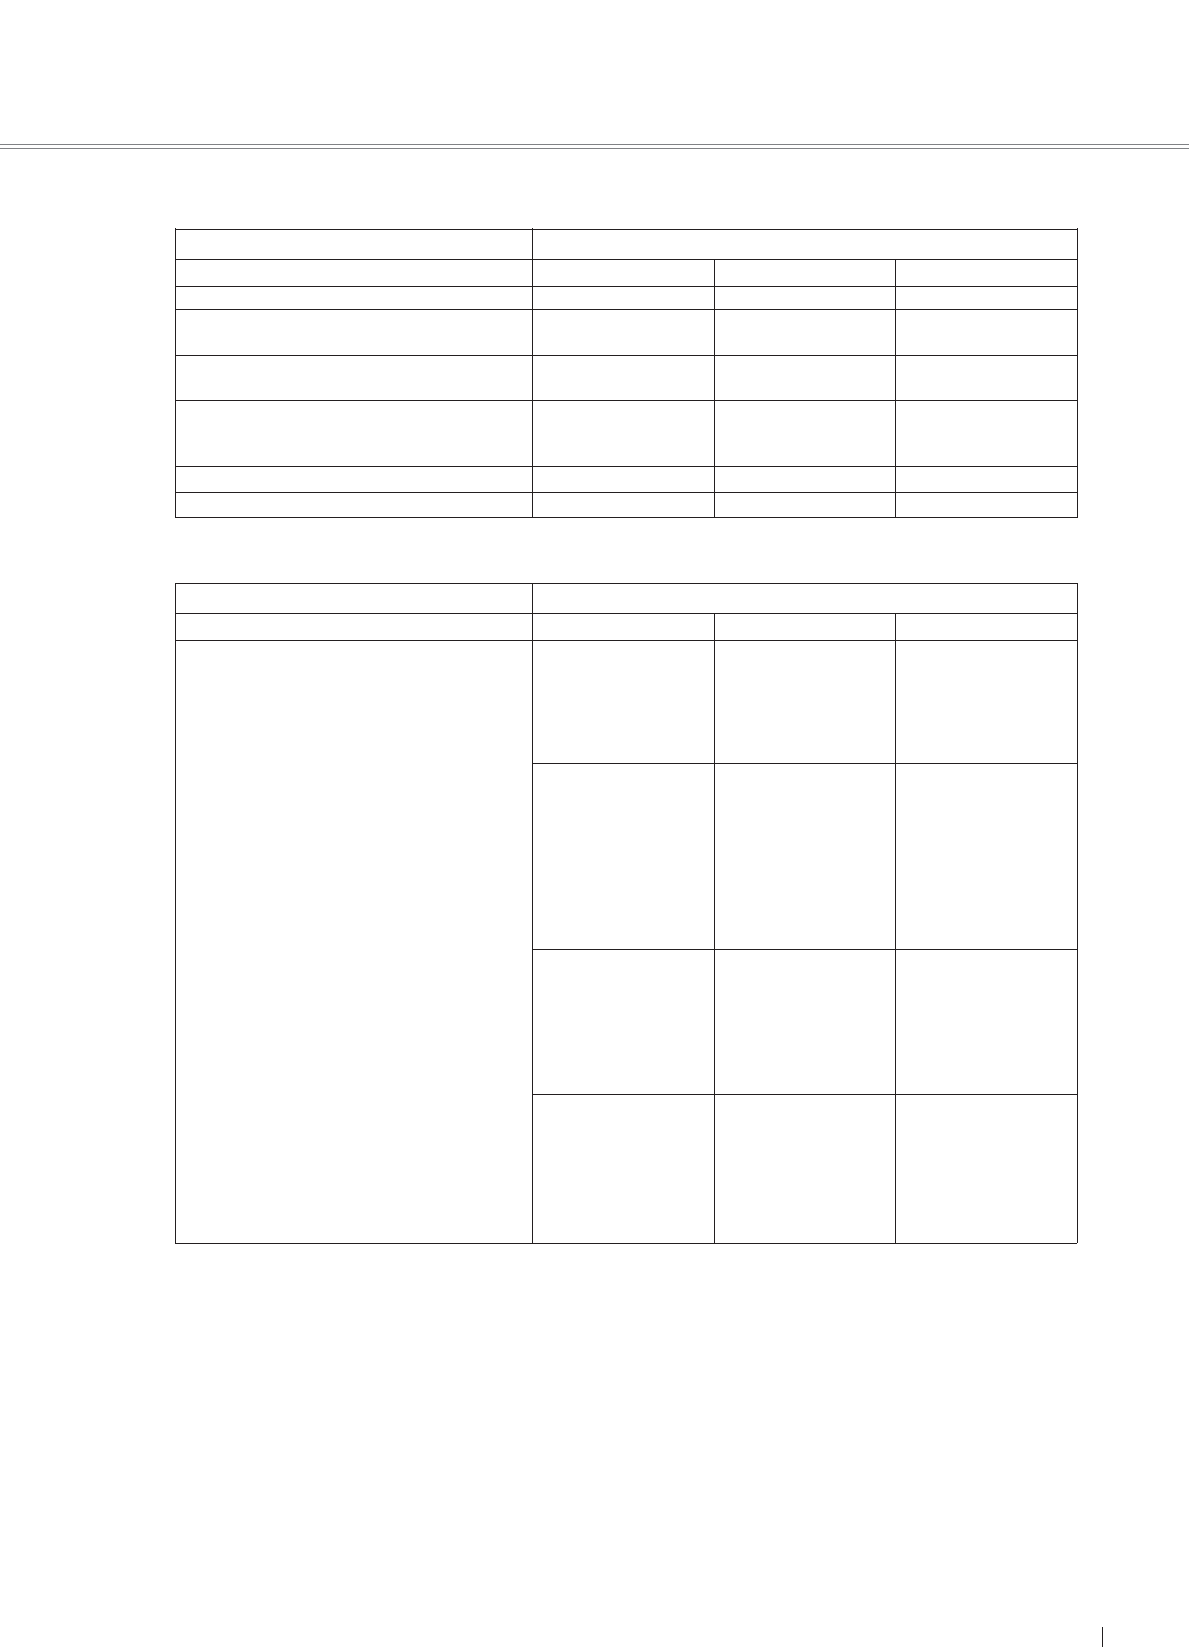
(2) Summarized consolidated statements of income by business segment (Millions of yen)
Current fiscal year (From April 1, 2007 to March 31, 2008)
Accounts Automobile & Eliminations Sales financing Consolidated total
Net sales 10,061,820 762,418 10,824,238
Cost of sales 7,820,372 587,026 8,407,398
Gross profit 2,241,448 175,392 2,416,840
Operating income as a percentage of net sales 7.1% 10.1% 7.3%
Operating income 713,893 76,937 790,830
Financial income/expenses—net (8,190) 277 (7,913)
Other non-operating income/expenses—net (16,169) (348) (16,517)
Ordinary income 689,534 76,866 766,400
Income before income taxes and minority interests 691,996 75,962 767,958
Net income 418,524 63,737 482,261
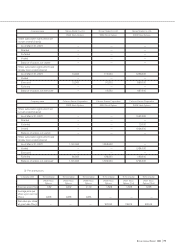
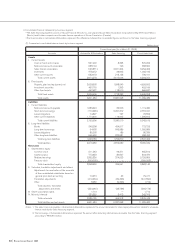
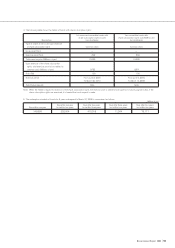
(3) Summarized consolidated statements of cash flows by business segment (Millions of yen)
Current fiscal year (From April 1, 2007 to March 31, 2008)
Accounts Automobile & Eliminations Sales financing Consolidated total
I. Cash flows from operating activities
Income before income taxes and minority
interests 691,996 75,962 767,958
Depreciation and amortization 471,565 357,607 829,172
Increase in finance receivables (72,550) (6,301) (78,851)
Others (209,086) 33,091 (175,995)
Net cash provided by operating activities 881,925 460,359 1,342,284
II. Cash flows from investing activities
Proceeds from sales of investment securities 8,936 — 8,936
Proceeds from sales of property, plant and
equipment 131,169 14 131,183
Purchases of fixed assets (456,876) (12,360) (469,236)
Purchases of leased vehicles (31,412) (830,654) (862,066)
Proceeds from sales of leased vehicles 3,253 390,165 393,418
Others (80,282) 10,424 (69,858)
Net cash used in investing activities (425,212) (442,411) (867,623)
III. Cash flows from financing activities
Net increase in short-term borrowings 20,489 4,908 25,397
Net change in long-term borrowings and
redemption of bonds (131,805) (158,995) (290,800)
Increase in bonds 99,759 137,116 236,875
Others (278,663) 189 (278,474)
Net cash used in financing activities (290,220) (16,782) (307,002)
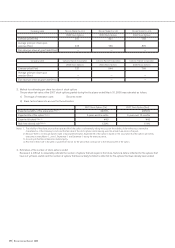
IV. Effect of exchange rate changes on cash and
cash equivalents (51,527) (1,451) (52,978)
V. Increase (decrease) in cash and cash equivalents 114,966 (285) 114,681
VI. Cash and cash equivalents at beginning of the year 459,964 9,424 469,388
VII. Increase due to inclusion in consolidation 33 — 33
VIII.Cash and cash equivalents at end of the year 574,963 9,139 584,102
Notes 1. The net increase in short-term borrowings of Automobile & Eliminations includes the amount of ¥5,747 million eliminated for increase in internal
loans receivable from the Sales financing segment.
2. The net change in long-term borrowings and redemption of bonds of Automobile & Eliminations includes the amount of ¥34,113 million
eliminated for increase in internal loans receivable from the Sales financing segment.