Nissan 2008 Annual Report Download - page 47
Download and view the complete annual report
Please find page 47 of the 2008 Nissan annual report below. You can navigate through the pages in the report by either clicking on the pages listed below, or by using the keyword search tool below to find specific information within the annual report.-
 1
1 -
2
-
3
-
4
-
5
-
6
-
7
-
8
-
9
-
10
-
11
-
12
-
13
-
14
-
15
-
16
-
17
-
18
-
19
-
20
-
21
-
22
-
23
-
24
-
25
-
26
-
27
-
28
-
29
-
30
-
31
-
32
-
33
-
34
-
35
-
36
-
 37
37 -
 38
38 -
 39
39 -
 40
40 -
 41
41 -
 42
42 -
 43
43 -
 44
44 -
 45
45 -
 46
46 -
 47
47 -
 48
48 -
 49
49 -
 50
50 -
 51
51 -
 52
52 -
 53
53 -
 54
54 -
 55
55 -
 56
56 -
 57
57 -
58
-
59
-
60
-
61
-
62
-
63
-
64
-
65
-
66
-
67
-
68
-
69
-
70
-
71
-
72
-
73
-
74
-
75
-
76
-
77
-
78
-
79
-
80
-
81
-
82
-
83
-
84
-
85
-
86
-
87
-
88
-
89
-
90
-
91
-
92
-
93
-
94
-
95
-
96
-
97
-
98
-
99
-
100
-
101
-
102
 |
 |

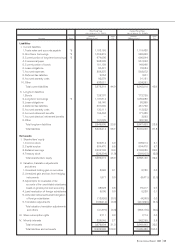
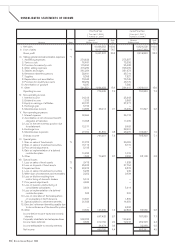
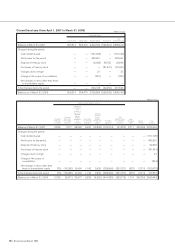
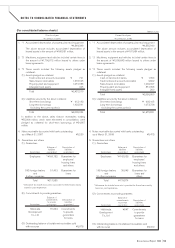
CONSOLIDATED STATEMENT OF CHANGES IN NET ASSETS
45
Nissan Annual Report 2008
Shareholders’ equity
Total
Common stock Capital surplus Retained earnings Treasury stock shareholders’ equity
Balance at March 31, 2006 605,814 804,470 2,116,825 (249,153) 3,277,956
Changes during the period:
Cash dividends paid — — (131,064) — (131,064)
Bonuses to directors and statutory
auditors — — (560) — (560)
Net income for the period — — 460,796 — 460,796
Disposal of treasury stock — — (3,477) 33,134 29,657
Purchases of treasury stock — — — (10,375) (10,375)
Changes due to merger — — 361 — 361
Change in the scope of consolidation — — (3,728) — (3,728)
Change in the scope of equity method — — (763) — (763)
Net changes in items other than those
in shareholders’ equity (Note) ——(35,664) — (35,664)
Total changes during the period — — 285,901 22,759 308,660
Balance as of March 31, 2007 605,814 804,470 2,402,726 (226,394) 3,586,616
Valuation, translation adjustments and others
Balance at March 31, 2006 14,340 — — — — (204,313) (189,973) 3,144 285,893 3,377,020
Changes during the period:
Cash dividends paid — — — — — — — — — (131,064)
Bonuses to directors and statutory
auditors — — — — — — — — — (560)
Net income for the period — — — — — — — — — 460,796
Disposal of treasury stock — — — — — — — — — 29,657
Purchases of treasury stock — — — — — — — — — (10,375)
Changes due to merger — — — — — — — — — 361
Change in the scope of consolidation — — — — — — — — — (3,728)
Change in the scope of equity method — — — — — — — — — (763)
Net changes in items other than
those in shareholders’ equity (Note) (8,514) 1,817 68,923 5,095 (13,826) 95,099 148,594 (433) 43,153 155,650
Total changes during the period (8,514) 1,817 68,923 5,095 (13,826) 95,099 148,594 (433) 43,153 499,974
Balance as of March 31, 2007 5,826 1,817 68,923 5,095 (13,826) (109,214) (41,379) 2,711 329,046 3,876,994
Total
valuation,
translation
adjustments
and others
Translation
adjustments
Unfunded
retirement
benefit
obligation
of foreign sub-
sidiaries
Land revalua-
tion of foreign
subsidiaries
Adjustment
for revaluation
of the
accounts of
the consoli-
dated sub-
sidiaries
based on
general price
level
accounting
Unrealized
gain from
hedging
instruments
Unrealized
holding gain
on securities
Share
subscription
rights
Minority
interests
Total
net assets
(Millions of yen)
(Millions of yen)
Note: As a result of the adoption of the Accounting Standard for Presentation of Net Assets in the Balance Sheet and the Accounting Standard for Statement of
Changes in Net Assets, ¥35,664 million, which had been included in Retained earnings at the end of the fiscal year ended March 31, 2006, has been
reclassified to Valuation, translation adjustments and others.
(Millions of yen)
Adjustments for revaluation of accounts of consolidated subsidiaries based on general price level accounting 49,915
Revaluation of land of foreign subsidiaries 5,134
Unfunded retirement benefit obligation of foreign subsidiaries (19,385)
Total amount reclassified from Retained earnings to Valuation, translation adjustments and others 35,664
Prior fiscal year (from April 1, 2006 to March 31, 2007)