Nissan 2008 Annual Report Download - page 82
Download and view the complete annual report
Please find page 82 of the 2008 Nissan annual report below. You can navigate through the pages in the report by either clicking on the pages listed below, or by using the keyword search tool below to find specific information within the annual report.-
 1
1 -
2
-
3
-
4
-
5
-
6
-
7
-
8
-
9
-
10
-
11
-
12
-
13
-
14
-
15
-
16
-
17
-
18
-
19
-
20
-
21
-
22
-
23
-
24
-
25
-
26
-
27
-
28
-
29
-
30
-
31
-
32
-
33
-
34
-
35
-
36
-
37
-
38
-
39
-
40
-
41
-
42
-
43
-
44
-
45
-
46
-
47
-
48
-
49
-
50
-
51
-
52
-
53
-
54
-
55
-
56
-
57
-
58
-
59
-
60
-
61
-
62
-
63
-
64
-
65
-
66
-
67
-
68
-
69
-
70
-
71
-
 72
72 -
 73
73 -
 74
74 -
 75
75 -
 76
76 -
 77
77 -
 78
78 -
 79
79 -
 80
80 -
 81
81 -
 82
82 -
 83
83 -
 84
84 -
 85
85 -
 86
86 -
 87
87 -
 88
88 -
 89
89 -
 90
90 -
 91
91 -
 92
92 -
93
-
94
-
95
-
96
-
97
-
98
-
99
-
100
-
101
-
102
 |
 |
80 Nissan Annual Report 2008
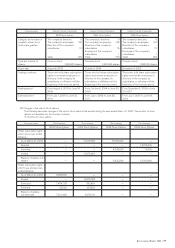
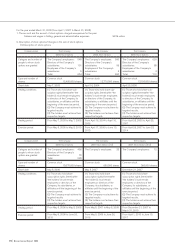
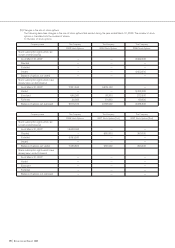
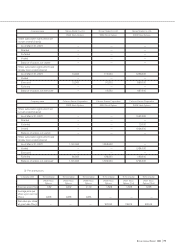
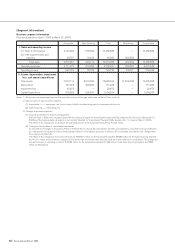
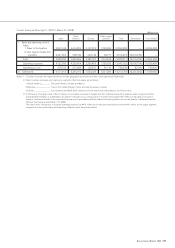
Business segment information
Prior fiscal year (from April 1, 2006 to March 31, 2007) (Millions of yen)
Automobile Sales financing Total Eliminations Consolidated
I. Sales and operating income
(1) Sales to third parties 9,790,484 678,099 10,468,583 — 10,468,583
(2) Inter-segment sales and
transfers 28,767 16,613 45,380 (45,380) —
Total sales 9,819,251 694,712 10,513,963 (45,380) 10,468,583
Operating expenses 9,171,272 618,959 9,790,231 (98,587) 9,691,644
Operating income 647,979 75,753 723,732 53,207 776,939
II. Assets, depreciation, impairment
loss, and capital expenditures
Total assets 7,910,116 5,910,380 13,820,496 (1,418,288) 12,402,208
Depreciation 447,924 323,299 771,223 — 771,223
Impairment loss 22,673 — 22,673 — 22,673
Capital Expenditure 578,363 925,841 1,504,204 — 1,504,204
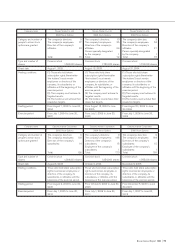
Notes: 1. Businesses are segmented based on their proximity in terms of the type, nature and markets of their products.
2. Main products of each business segment
(1) Automobile.................... passenger cars, trucks, buses, forklifts, manufacturing parts for oversea production, etc.
(2) Sales financing.......... credit, lease, etc.
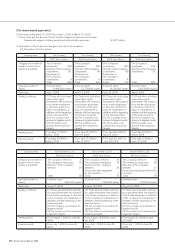
3. Changes in accounting policies
(1) Accounting standard for share-based payments
Effective April 1, 2006, the Company adopted the Accounting Standard for Share-Based Payment (ASBJ Statement No. 8 issued on December 27,
2005) and the Implementation Guidance on Accounting Standard for Share-Based Payment (ASBJ Guidance No. 11 issued on May 31, 2006).
The effect of this change was to decrease the operating income of the Automobile segment by ¥1,037 million.
(2) Change of closing dates of consolidated subsidiaries
As described in “Changes in Accounting Policies,” effective this fiscal year, 22 subsidiaries have been consolidated by using their financial statements
as of the parent’s fiscal year end which were prepared solely for consolidation purposes. In addition, 33 consolidated subsidiaries have changed their
fiscal year end to March 31.
The effect of this change was to increase net sales by ¥759,391 million for the Automobile segment, ¥9,586 million for the Sales financing segment
and ¥1,371 million for Eliminations, compared to the results that would have been obtained under the former method of consolidation. This change also
brought increases in operating income of ¥18,785 million for the Automobile segment, ¥1,796 million for the Sales financing segment, and ¥862
million for Eliminations.
(Segment Information)