Nissan 2008 Annual Report Download - page 14
Download and view the complete annual report
Please find page 14 of the 2008 Nissan annual report below. You can navigate through the pages in the report by either clicking on the pages listed below, or by using the keyword search tool below to find specific information within the annual report.-
 1
1 -
2
-
3
-
 4
4 -
 5
5 -
 6
6 -
 7
7 -
 8
8 -
 9
9 -
 10
10 -
 11
11 -
 12
12 -
 13
13 -
 14
14 -
 15
15 -
 16
16 -
 17
17 -
 18
18 -
 19
19 -
 20
20 -
 21
21 -
 22
22 -
 23
23 -
 24
24 -
25
-
26
-
27
-
28
-
29
-
30
-
31
-
32
-
33
-
34
-
35
-
36
-
37
-
38
-
39
-
40
-
41
-
42
-
43
-
44
-
45
-
46
-
47
-
48
-
49
-
50
-
51
-
52
-
53
-
54
-
55
-
56
-
57
-
58
-
59
-
60
-
61
-
62
-
63
-
64
-
65
-
66
-
67
-
68
-
69
-
70
-
71
-
72
-
73
-
74
-
75
-
76
-
77
-
78
-
79
-
80
-
81
-
82
-
83
-
84
-
85
-
86
-
87
-
88
-
89
-
90
-
91
-
92
-
93
-
94
-
95
-
96
-
97
-
98
-
99
-
100
-
101
-
102
 |
 |

12 Nissan Annual Report 2008
PERFORMANCE
FISCAL 2007 FINANCIAL REVIEW
Nissan reported increases during fiscal 2007 in
revenue, operating profit and net income. In a
challenging year for the entire automotive
industry, our employees performed at high
levels, keeping the company on track despite
facing powerful headwinds.
When comparing the results of fiscal 2007 with
fiscal 2006, please note that we exclude an
additional one-time “fifth quarter” used in the latter.
This fifth quarter was added to harmonize the
calendar-year results of overseas subsidiaries, such
as Europe and Mexico, with fiscal-year results for
Nissan Motor Co., Ltd. The impact of this fifth quarter
in fiscal 2006 was ¥767.6 billion in revenues, ¥21.4
billion in operating profits and ¥11.6 billion in net
income.
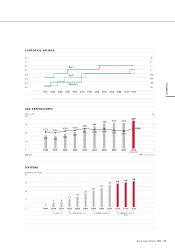
Net sales
For fiscal 2007, Nissan’s consolidated net sales
came to ¥10,824.2 billion, up 11.6 percent from last
year. This positive variance was mainly due to gains
in sales volume. Favorable changes in foreign
exchange rates for currencies such as the euro also
contributed to this improvement.
Operating profit
Our consolidated operating profit increased 4.7
percent to ¥790.8 billion, compared to ¥755.5 billion
in fiscal 2006. As a percentage of net revenue,
operating profit margin came to 7.3 percent.
The variance in consolidated operating profit
between the fiscal 2007 total of ¥790.8 billion and
the unaudited figure of ¥755.2 billion during fiscal
2006—the latter adjusted for the same period as
fiscal 2007 at each subsidiary to avoid the impact of
fiscal year period differences—was the result of the
following factors:
• Purchasing-cost reductions generated a
positive contribution of ¥172.9 billion
• Price, volume and mix had a positive impact of
¥75.0 billion
• A decrease in warranty expenses resulted in a
positive contribution of ¥7.6 billion
• Increased raw material and energy costs had a
negative impact of ¥84.7 billion
• Product enrichment, including regulatory costs,
lowered profits by ¥52.2 billion
• Selling expenses had a ¥38.1 billion negative
impact
• Higher general, administrative and other
expenses had negative impact of ¥18.0 billion
• Foreign exchange rate movements had a
negative effect of ¥16.2 billion. This was
primarily the result of unfavorable movements
by the U.S. dollar, which averaged ¥114.4
compared to ¥117.0 the previous year. The
euro moved to ¥161.6 from ¥146.2.
• Increased manufacturing expenses had a
negative effect of ¥9.2 billion
• Higher R&D expenses created a negative
impact of ¥1.5 billion
Net income
Negative foreign exchange rates were primarily
responsible for pushing our net non-operating
expenses up from last year’s ¥12.9 billion to ¥24.4
billion.
Net extraordinary items contributed a positive
¥1.6 billion, representing a significant improvement
over a negative ¥60.8 billion in fiscal 2006. This
positive variance came from a combination of this
year’s gain on sale of fixed assets—mainly in
Japan—and last year’s one-time losses, which
included headcount reduction programs.
Pre-tax income was ¥768.0 billion, and taxes
totaled ¥262.7 billion, representing an effective
consolidated tax rate of 34.2 percent.
Minority interests, which are profits from fully
consolidated companies that Nissan does not own
outright, such as Calsonic Kansei, Aichi Kikai and
Nissan Shatai, amounted to ¥23.0 billion. Net income
increased 7.4 percent to ¥482.3 billion, versus
¥449.2 billion in fiscal 2006.