Nissan 2008 Annual Report Download - page 49
Download and view the complete annual report
Please find page 49 of the 2008 Nissan annual report below. You can navigate through the pages in the report by either clicking on the pages listed below, or by using the keyword search tool below to find specific information within the annual report.-
 1
1 -
2
-
3
-
4
-
5
-
6
-
7
-
8
-
9
-
10
-
11
-
12
-
13
-
14
-
15
-
16
-
17
-
18
-
19
-
20
-
21
-
22
-
23
-
24
-
25
-
26
-
27
-
28
-
29
-
30
-
31
-
32
-
33
-
34
-
35
-
36
-
37
-
38
-
 39
39 -
 40
40 -
 41
41 -
 42
42 -
 43
43 -
 44
44 -
 45
45 -
 46
46 -
 47
47 -
 48
48 -
 49
49 -
 50
50 -
 51
51 -
 52
52 -
 53
53 -
 54
54 -
 55
55 -
 56
56 -
 57
57 -
 58
58 -
 59
59 -
60
-
61
-
62
-
63
-
64
-
65
-
66
-
67
-
68
-
69
-
70
-
71
-
72
-
73
-
74
-
75
-
76
-
77
-
78
-
79
-
80
-
81
-
82
-
83
-
84
-
85
-
86
-
87
-
88
-
89
-
90
-
91
-
92
-
93
-
94
-
95
-
96
-
97
-
98
-
99
-
100
-
101
-
102
 |
 |
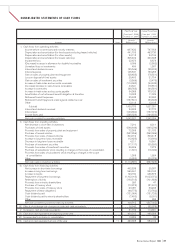
CONSOLIDATED STATEMENTS OF CASH FLOWS
47
Nissan Annual Report 2008
Prior Fiscal Year Current Fiscal
Year
From April 1, 2006 From April 1, 2007
[
To March 31, 2007
][
To March 31, 2008
]
Amounts Amounts
Accounts Notes (Millions of yen) (Millions of yen)
I. Cash flows from operating activities
Income before income taxes and minority interests 697,432 767,958
Depreciation and amortization (for fixed assets excluding leased vehicles) 441,703 463,730
Depreciation and amortization (for other assets) 24,118 24,744
Depreciation and amortization (for leased vehicles) 305,402 340,698
Impairment loss 22,673 8,878
(Decrease) increase in allowance for doubtful receivables 9,996 (2,552)
Unrealized loss on investments 459 1,597
Interest and dividend income (25,546) (28,205)
Interest expense 145,547 159,285
Gain on sales of property, plant and equipment (28,485) (78,551)
Loss on disposal of fixed assets 25,403 21,754
Gain on sales of investment securities (3,566) (3,475)
Increase in trade notes and accounts receivable (114,960) (44,245)
(Increase) decrease in sales finance receivables 44,341 (78,851)
Increase in inventories (88,765) (40,581)
Increase in trade notes and accounts payable 54,368 103,123
Amortization of net retirement benefit obligation at transition 10,928 11,009
Retirement benefit expenses 55,438 52,260
Retirement benefit payments made against related accrual (157,821) (53,303)
Other 12,118 12,108
Subtotal 1,430,783 1,637,381
Interest and dividends received 24,622 27,770
Interest paid (143,650) (157,974)
Income taxes paid (268,928) (164,893)
Net cash provided by operating activities 1,042,827 1,342,284
II. Cash flows from investing activities
Net decrease in short-term investments 7,210 6,311
Purchases of fixed assets (546,848) (469,236)
Proceeds from sales of property, plant and equipment 72,308 131,183
Purchase of leased vehicles (957,356) (862,066)
Proceeds from sales of leased vehicles 304,912 393,418
Increase in long-term loans receivable (12,625) (13,900)
Decrease in long-term loans receivable 4,211 10,561
Purchase of investment securities (17,117) (35,820)
Proceeds from sales of investment securities 36,486 7,272
Purchase of subsidiaries’ stock resulting in changes in the scope of consolidation *2 (1,391) (16,032)
Proceeds from sales of subsidiaries’ stock resulting in changes in the scope
of consolidation 1,308 1,664
Other (5,685) (20,978)
Net cash used in investing activities (1,114,587) (867,623)
III. Cash flows from financing activities
Net increase in short-term borrowings 492,538 25,397
Increase in long-term borrowings 969,461 834,160
Increase in bonds 123,730 236,875
Repayment of long-term borrowings (1,102,015) (1,023,072)
Redemption of bonds (190,515) (101,888)
Proceeds from minority shareholders 260 47
Purchase of treasury stock (10,375) (81,341)
Proceeds from sales of treasury stock 29,087 33,203
Repayment of lease obligations (66,775) (72,762)
Cash dividends paid (131,064) (151,725)
Cash dividends paid to minority shareholders (7,453) (6,291)
Other 33 395
Net cash provided by (used in) financing activities 106,912 (307,002)
IV. Effects of exchange rate changes on cash and cash equivalents 16,640 (52,978)
V. Increase in cash and cash equivalents 51,792 114,681
VI. Cash and cash equivalents at beginning of the year 404,212 469,388
VII. Increase due to inclusion in consolidation 13,384 33
VIII. Cash and cash equivalents at end of the year *1 469,388 584,102