Nissan 2008 Annual Report Download - page 16
Download and view the complete annual report
Please find page 16 of the 2008 Nissan annual report below. You can navigate through the pages in the report by either clicking on the pages listed below, or by using the keyword search tool below to find specific information within the annual report.-
 1
1 -
2
-
3
-
4
-
5
-
 6
6 -
 7
7 -
 8
8 -
 9
9 -
 10
10 -
 11
11 -
 12
12 -
 13
13 -
 14
14 -
 15
15 -
 16
16 -
 17
17 -
 18
18 -
 19
19 -
 20
20 -
 21
21 -
 22
22 -
 23
23 -
 24
24 -
 25
25 -
 26
26 -
27
-
28
-
29
-
30
-
31
-
32
-
33
-
34
-
35
-
36
-
37
-
38
-
39
-
40
-
41
-
42
-
43
-
44
-
45
-
46
-
47
-
48
-
49
-
50
-
51
-
52
-
53
-
54
-
55
-
56
-
57
-
58
-
59
-
60
-
61
-
62
-
63
-
64
-
65
-
66
-
67
-
68
-
69
-
70
-
71
-
72
-
73
-
74
-
75
-
76
-
77
-
78
-
79
-
80
-
81
-
82
-
83
-
84
-
85
-
86
-
87
-
88
-
89
-
90
-
91
-
92
-
93
-
94
-
95
-
96
-
97
-
98
-
99
-
100
-
101
-
102
 |
 |

14 Nissan Annual Report 2008
PERFORMANCE
Automotive net cash change
Cash generated by automotive operations totaled
¥1,110.1 billion. Free cash flow equaled ¥456.7
billion, thanks primarily to improvement in working
capital. Cash used for financing activities totaled
¥333.5 billion, including ¥151.7 billion for dividend
payments.
Nissan had a net cash position of ¥180.3 billion
at the end of fiscal 2007, representing a decrease of
¥74.4 billion compared to the beginning of the fiscal
year. This was the combined result of an increase in
cash used in financing activities and a decrease in
the effect of exchange rate changes of ¥197.6
billion, which were offset by the increase in free cash
flow.
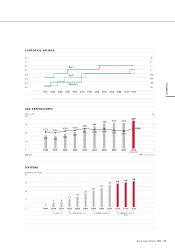
Credit rating
Moody’s upgraded Nissan’s rating from Baa1 to A3
on September 5, 2007. As of May 16, 2006, R&I
was listing Nissan’s long-term credit rating as A,
while S&P upgraded the company’s rating from BBB
to BBB+ on July 20, 2004.
Investment policy
Our capital expenditures totaled ¥428.9 billion, equal
to 4.0 percent of net revenue, including funds used
to launch eleven all-new models during the course of
fiscal 2007. R&D expenditures were ¥457.5 billion.
These funds were used to develop new technologies
and products. Nissan launched ten new technologies
in fiscal 2007. We will continue this trend with ten
new technologies in fiscal 2008, and over fifteen
new technologies in 2009 and the years beyond. Our
strength is the extensive collaborative development
structure Nissan enjoys with Renault’s R&D team
through the Alliance.
Payout policy
At the annual general shareholders meeting that
followed on June 25, 2008, the company proposed
an increase in its annual dividend from ¥34 per
share in 2006 to ¥40 per share in fiscal 2007.
In addition to announcing the new NISSAN GT
2012 midterm plan, Nissan revealed a new dividend
plan on May 13, 2008. Nissan will propose a
dividend of ¥42 per share in fiscal 2008, ¥44 per
share in fiscal 2009, and ¥46 per share in fiscal
2010. The company will propose dividend payouts
for fiscal 2011 and 2012 during fiscal 2010.
Change to free cash flow from return on
invested capital
At the end of fiscal 2007, Nissan’s return on
invested capital (ROIC) was 16.0 percent. The ROIC
average for the NISSAN Value-Up period (fiscal
2005 to 2007) was 17 percent. While that ranks us
at the top level among global automakers, it was
below our commitment of 20 percent. To optimize
profit and investment during NISSAN GT 2012,
Nissan has changed its internal objective from ROIC
to maximizing free cash flow, since the latter covers
a wider range of income statement and balance
sheet items.