Motorola 2008 Annual Report Download - page 93
Download and view the complete annual report
Please find page 93 of the 2008 Motorola annual report below. You can navigate through the pages in the report by either clicking on the pages listed below, or by using the keyword search tool below to find specific information within the annual report.-
 1
1 -
2
-
3
-
4
-
5
-
6
-
7
-
8
-
9
-
10
-
11
-
12
-
13
-
14
-
15
-
16
-
17
-
18
-
19
-
20
-
21
-
22
-
23
-
24
-
25
-
26
-
27
-
28
-
29
-
30
-
31
-
32
-
33
-
34
-
35
-
36
-
37
-
38
-
39
-
40
-
41
-
42
-
43
-
44
-
45
-
46
-
47
-
48
-
49
-
50
-
51
-
52
-
53
-
54
-
55
-
56
-
57
-
58
-
59
-
60
-
61
-
62
-
63
-
64
-
65
-
66
-
67
-
68
-
69
-
70
-
71
-
72
-
73
-
74
-
75
-
76
-
77
-
78
-
79
-
80
-
81
-
82
-
 83
83 -
 84
84 -
 85
85 -
 86
86 -
 87
87 -
 88
88 -
 89
89 -
 90
90 -
 91
91 -
 92
92 -
 93
93 -
 94
94 -
 95
95 -
 96
96 -
 97
97 -
 98
98 -
 99
99 -
 100
100 -
 101
101 -
 102
102 -
 103
103 -
104
-
105
-
106
-
107
-
108
-
109
-
110
-
111
-
112
-
113
-
114
-
115
-
116
-
117
-
118
-
119
-
120
-
121
-
122
-
123
-
124
-
125
-
126
-
127
-
128
-
129
-
130
-
131
-
132
-
133
-
134
-
135
-
136
-
137
-
138
-
139
-
140
-
141
-
142
-
143
-
144
-
145
-
146
-
147
-
148
-
149
-
150
-
151
-
152
-
153
-
154
-
155
-
156
 |
 |

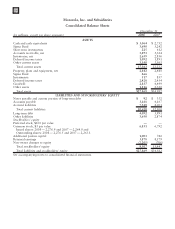
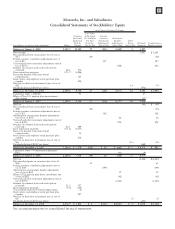
Motorola, Inc. and Subsidiaries
Consolidated Statements of Stockholders’ Equity
(In millions, except per share amounts) Shares
Common
Stock and
Additional
Paid-In
Capital
Fair Value
Adjustment
To Available
For Sale
Securities,
Net of Tax
Foreign
Currency
Translation
Adjustments,
Net of Tax
Retirement
Benefits
Adjustments,
Net of Tax
Other
Items,
Net of Tax
Retained
Earnings
Comprehensive
Earnings (Loss)
Non-Owner Changes To Equity
Balances at January 1, 2006 2,502.7 12,199 97 (253) (1,269) 2 5,897
Net earnings 3,661 $ 3,661
Net unrealized losses on securities (net of tax of
$37) (60) (60)
Foreign currency translation adjustments (net of
tax of $1) 127 127
Year-end and other retirement adjustments (net of
tax of $150) (308) 206
Issuance of common stock and stock options
exercised 68.1 916
Share repurchase program (171.7) (3,826)
Excess tax benefits from share-based
compensation 165
Stock option and employee stock purchase plan
expense 252
Net gain on derivative instruments (net of tax of
$6) 14 14
Dividends declared ($0.19 per share) (472)
Balances at December 31, 2006 2,399.1 9,706 37 (126) (1,577) 16 9,086 $ 3,948
Cumulative effect — FIN 48 93 27
Effect of Non-U.S. pension plan measurement
date change (17)
Balances at January 1, 2007 2,399.1 9,799 37 (126) (1,577) 16 9,096
Net loss (49) $ (49)
Net unrealized losses on securities (net of tax of
$58) (96) (96)
Foreign currency translation adjustments (net of
tax of $3) 142 142
Amortization of retirement benefits adjustments
(net of tax of $39) 62 62
Year-end and other retirement adjustments (net of
tax of $328) 852 852
Issuance of common stock and stock options
exercised 36.1 484
Share repurchase program (171.2) (3,035)
Excess tax benefits from share-based
compensation 50
Stock option and employee stock purchase plan
expense 276
Net loss on derivative instruments (net of tax of
$6) (16) (16)
Dividends declared ($0.20 per share) (468)
Balances at December 31, 2007 2,264.0 $ 7,574 $(59) $ 16 $ (663) $ — $ 8,579 $ 895
Cumulative effect — Postretirement Insurance
Plan (41) (4)
Balances at January 1, 2008 2,264.0 7,574 (59) 16 (704) — 8,575
Net loss (4,244) $(4,244)
Net unrealized gains on securities (net of tax of
$36) 61 61
Foreign currency translation adjustments (net of
tax of $39) (149) (149)
Amortization of retirement benefit adjustments
(net of tax of $10) 19 19
Effect of U.S. pension plan freeze curtailment (net
of tax of $25) (42) (42)
Year-end and other retirement adjustments (net of
tax of $793) (1,340) (1,340)
Issuance of common stock and stock options
exercised 21.9 197
Share repurchase program (9.0) (138)
Tax shortfalls from share-based compensation (6)
Stock option and employee stock purchase plan
expense 207
Net loss on derivative instruments (net of tax of
$5) (7) (7)
Dividends declared ($0.20 per share) (453)
Balances at December 31, 2008 2,276.9 $ 7,834 $ 2 $(133) $(2,067) $ (7) $ 3,878 $(5,702)
See accompanying notes to consolidated financial statements.
85