Motorola 2008 Annual Report Download - page 64
Download and view the complete annual report
Please find page 64 of the 2008 Motorola annual report below. You can navigate through the pages in the report by either clicking on the pages listed below, or by using the keyword search tool below to find specific information within the annual report.-
 1
1 -
2
-
3
-
4
-
5
-
6
-
7
-
8
-
9
-
10
-
11
-
12
-
13
-
14
-
15
-
16
-
17
-
18
-
19
-
20
-
21
-
22
-
23
-
24
-
25
-
26
-
27
-
28
-
29
-
30
-
31
-
32
-
33
-
34
-
35
-
36
-
37
-
38
-
39
-
40
-
41
-
42
-
43
-
44
-
45
-
46
-
47
-
48
-
49
-
50
-
51
-
52
-
53
-
 54
54 -
 55
55 -
 56
56 -
 57
57 -
 58
58 -
 59
59 -
 60
60 -
 61
61 -
 62
62 -
 63
63 -
 64
64 -
 65
65 -
 66
66 -
 67
67 -
 68
68 -
 69
69 -
 70
70 -
 71
71 -
 72
72 -
 73
73 -
 74
74 -
75
-
76
-
77
-
78
-
79
-
80
-
81
-
82
-
83
-
84
-
85
-
86
-
87
-
88
-
89
-
90
-
91
-
92
-
93
-
94
-
95
-
96
-
97
-
98
-
99
-
100
-
101
-
102
-
103
-
104
-
105
-
106
-
107
-
108
-
109
-
110
-
111
-
112
-
113
-
114
-
115
-
116
-
117
-
118
-
119
-
120
-
121
-
122
-
123
-
124
-
125
-
126
-
127
-
128
-
129
-
130
-
131
-
132
-
133
-
134
-
135
-
136
-
137
-
138
-
139
-
140
-
141
-
142
-
143
-
144
-
145
-
146
-
147
-
148
-
149
-
150
-
151
-
152
-
153
-
154
-
155
-
156
 |
 |

Investments: In addition to available cash and cash equivalents, Sigma Fund balances (current and non-
current) and short-term investments, the Company views its investments as an additional source of liquidity. The
majority of these securities are available-for-sale and cost-method investments in technology companies. The fair
market values of these securities are subject to substantial price volatility. In addition, the realizable value of these
securities is subject to market and other conditions. At December 31, 2008, the Company’s available-for-sale
equity securities portfolio had an approximate fair market value of $128 million, which represented a cost basis of
$125 million and a net unrealized gain of $3 million. At December 31, 2007, the Company’s available-for-sale
securities portfolio had an approximate fair market value of $333 million, which represented a cost basis of
$372 million and a net unrealized loss of $39 million. At December 31, 2008 and 2007, the Company’s cost-
method investment portfolio had an approximate recorded value of $296 million and $414 million, respectively.
Financing Activities
The most significant components of the Company’s financing activities are: (i) payment of dividends,
(ii) repayment and repurchase of debt, (iii) issuance of common stock, and (iv) purchases of the Company’s
common stock under its share repurchase program.
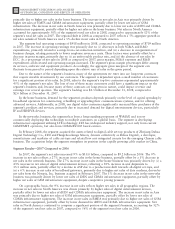
Net cash used for financing activities from continuing operations was $645 million in 2008, compared to
$3.3 billion of cash used in 2007 and $3.2 billion of cash used in 2006. Cash used for financing activities from
continuing operations in 2008 was primarily: (i) $453 million of cash used to pay dividends, (ii) $225 million of
cash used for the repayment and repurchase of debt, (iii) $138 million of cash used to purchase approximately
9.0 million shares of the Company’s common stock under the share repurchase program, all during the first
quarter of 2008, (iv) $90 million in distributions to discontinued operations, and (v) $50 million of net cash used
for the repayment of short-term borrowings, partially offset by: (i) $158 million of proceeds from the termination
of interest rate swaps, and (ii) $145 million of net cash received from the issuance of common stock in connection
with the Company’s employee stock option plans and employee stock purchase plan.
Net cash used for financing activities from continuing operations in 2007 was primarily: (i) $3.0 billion of
cash used to purchase 171.2 million shares of the Company’s common stock under the share repurchase program,
(ii) $1.4 billion of cash used for the repayment of maturing debt, (iii) $468 million of cash used to pay dividends,
(iv) $242 million of net cash used for the repayment of commercial paper and short-term borrowings, and
(v) $75 million in distributions to discontinued operations, partially offset by proceeds of: (i) $1.4 billion received
from the issuance of long-term debt, (ii) $440 million received from the issuance of common stock in connection
with the Company’s employee stock option plans and employee stock purchase plan, and (iii) $50 million in excess
tax benefits from share-based compensation.
Commercial Paper and Other Short-Term Debt: At December 31, 2008, the Company’s outstanding notes
payable and current portion of long-term debt was $92 million, compared to $332 million at December 31, 2007.
In March 2008, the Company repaid, at maturity, the entire $114 million outstanding of 6.50% Senior Notes due
March 1, 2008. In October 2008, the Company repaid, at maturity, the entire $84 million outstanding of
5.80% Notes due October 15, 2008.
In November 2007, the Company repaid, at maturity, the entire $1.2 billion aggregate principal amount
outstanding of its 4.608% Senior Notes due November 16, 2007. In January 2007, the Company repaid, at
maturity, the entire $118 million aggregate principal amount outstanding of its 7.6% Notes due January 1, 2007.
Net cash used for the repayment of short-term borrowings was $50 million in 2008, compared to repayment
of $242 million of commercial paper and short-term borrowings in 2007. At December 31, 2008 and 2007, the
Company had no commercial paper outstanding. The capital and credit markets have been experiencing extreme
volatility and reduced liquidity for the past 12 months. Routine access to the commercial paper market has been
limited for issuers like the Company, which have non-rated or split short-term ratings. If the Company were to
issue commercial paper under the current market conditions, the funding costs the Company would have to pay to
issue commercial paper would be much higher than historical levels, and the tenors would likely be limited to
overnight borrowings.
Long-term Debt: At December 31, 2008, the Company had outstanding long-term debt of $4.1 billion,
compared to $4.0 billion at December 31, 2007. Although we believe that we will be able to maintain sufficient
access to the capital markets, the current volatility and reduced liquidity in the financial markets may result in
periods of time when access to the capital markets is limited for all issuers or issuers with credit ratings similar to
the Company’s.
56 MANAGEMENT’S DISCUSSION AND ANALYSIS
OF FINANCIAL CONDITION AND RESULTS OF OPERATIONS