Motorola 2008 Annual Report Download - page 140
Download and view the complete annual report
Please find page 140 of the 2008 Motorola annual report below. You can navigate through the pages in the report by either clicking on the pages listed below, or by using the keyword search tool below to find specific information within the annual report.-
 1
1 -
2
-
3
-
4
-
5
-
6
-
7
-
8
-
9
-
10
-
11
-
12
-
13
-
14
-
15
-
16
-
17
-
18
-
19
-
20
-
21
-
22
-
23
-
24
-
25
-
26
-
27
-
28
-
29
-
30
-
31
-
32
-
33
-
34
-
35
-
36
-
37
-
38
-
39
-
40
-
41
-
42
-
43
-
44
-
45
-
46
-
47
-
48
-
49
-
50
-
51
-
52
-
53
-
54
-
55
-
56
-
57
-
58
-
59
-
60
-
61
-
62
-
63
-
64
-
65
-
66
-
67
-
68
-
69
-
70
-
71
-
72
-
73
-
74
-
75
-
76
-
77
-
78
-
79
-
80
-
81
-
82
-
83
-
84
-
85
-
86
-
87
-
88
-
89
-
90
-
91
-
92
-
93
-
94
-
95
-
96
-
97
-
98
-
99
-
100
-
101
-
102
-
103
-
104
-
105
-
106
-
107
-
108
-
109
-
110
-
111
-
112
-
113
-
114
-
115
-
116
-
117
-
118
-
119
-
120
-
121
-
122
-
123
-
124
-
125
-
126
-
127
-
128
-
129
-
 130
130 -
 131
131 -
 132
132 -
 133
133 -
 134
134 -
 135
135 -
 136
136 -
 137
137 -
 138
138 -
 139
139 -
 140
140 -
 141
141 -
 142
142 -
 143
143 -
 144
144 -
 145
145 -
 146
146 -
 147
147 -
 148
148 -
 149
149 -
 150
150 -
151
-
152
-
153
-
154
-
155
-
156
 |
 |

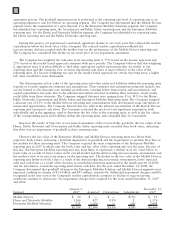
16. Quarterly and Other Financial Data (unaudited)*
1st 2nd 3rd 4th
(1)
1st 2nd 3rd 4th
2008 2007
Operating Results
Net sales $7,448 $8,082 $7,480 $ 7,136 $9,433 $8,732 $8,811 $9,646
Costs of sales 5,303 5,757 5,677 5,014 6,979 6,279 6,306 7,106
Gross margin 2,145 2,325 1,803 2,122 2,454 2,453 2,505 2,540
Selling, general and administrative
expenses 1,183 1,115 1,044 988 1,313 1,296 1,210 1,273
Research and development expenditures 1,054 1,048 999 1,008 1,117 1,115 1,100 1,097
Other charges 177 157 212 1,801 390 200 205 189
Operating earnings (loss) (269) 5 (452) (1,675) (366) (158) (10) (19)
Earnings (loss) from continuing operations (194) 4 (397) (3,657) (218) (38) 40 111
Net earnings (loss) (194) 4 (397) (3,657) (181) (28) 60 100
Per Share Data (in dollars)
Continuing Operations:
Basic earnings (loss) per common share $ (0.09) $ 0.00 $ (0.18) $ (1.61) $ (0.09) $ (0.02) $ 0.02 $ 0.05
Diluted earnings (loss) per common share (0.09) 0.00 (0.18) (1.61) (0.09) (0.02) 0.02 0.05
Net Earnings:
Basic earnings (loss) per common share (0.09) 0.00 (0.18) (1.61) (0.08) (0.01) 0.03 0.04
Diluted earnings (loss) per common share (0.09) 0.00 (0.18) (1.61) (0.08) (0.01) 0.03 0.04
Dividends declared 0.05 0.05 0.05 0.05 0.05 0.05 0.05 0.05
Dividends paid 0.05 0.05 0.05 0.05 0.05 0.05 0.05 0.05
Stock prices
High 16.20 10.38 10.50 7.52 20.91 19.18 18.88 19.68
Low 8.98 7.20 6.52 3.00 17.45 17.32 15.61 14.87
(1) Includes: (i) a $2.1 billion charge related to increase the U.S. deferred tax asset valuation allowance, as
described in Note 6, “Income Taxes”, (ii) a $1.6 billion charge related to the impairment of goodwill, as
described in Note 14, “Acquisitions and Related Intangibles”, and (iii) accumulated temporary unrealized
losses in Sigma Fund investments, as described in Note 3, “Other Financial Data”.
* Certain amounts in prior years’ financial statements and related notes have been reclassified to conform to the
2008 presentation.
132