Motorola 2008 Annual Report Download - page 110
Download and view the complete annual report
Please find page 110 of the 2008 Motorola annual report below. You can navigate through the pages in the report by either clicking on the pages listed below, or by using the keyword search tool below to find specific information within the annual report.-
 1
1 -
2
-
3
-
4
-
5
-
6
-
7
-
8
-
9
-
10
-
11
-
12
-
13
-
14
-
15
-
16
-
17
-
18
-
19
-
20
-
21
-
22
-
23
-
24
-
25
-
26
-
27
-
28
-
29
-
30
-
31
-
32
-
33
-
34
-
35
-
36
-
37
-
38
-
39
-
40
-
41
-
42
-
43
-
44
-
45
-
46
-
47
-
48
-
49
-
50
-
51
-
52
-
53
-
54
-
55
-
56
-
57
-
58
-
59
-
60
-
61
-
62
-
63
-
64
-
65
-
66
-
67
-
68
-
69
-
70
-
71
-
72
-
73
-
74
-
75
-
76
-
77
-
78
-
79
-
80
-
81
-
82
-
83
-
84
-
85
-
86
-
87
-
88
-
89
-
90
-
91
-
92
-
93
-
94
-
95
-
96
-
97
-
98
-
99
-
 100
100 -
 101
101 -
 102
102 -
 103
103 -
 104
104 -
 105
105 -
 106
106 -
 107
107 -
 108
108 -
 109
109 -
 110
110 -
 111
111 -
 112
112 -
 113
113 -
 114
114 -
 115
115 -
 116
116 -
 117
117 -
 118
118 -
 119
119 -
 120
120 -
121
-
122
-
123
-
124
-
125
-
126
-
127
-
128
-
129
-
130
-
131
-
132
-
133
-
134
-
135
-
136
-
137
-
138
-
139
-
140
-
141
-
142
-
143
-
144
-
145
-
146
-
147
-
148
-
149
-
150
-
151
-
152
-
153
-
154
-
155
-
156
 |
 |

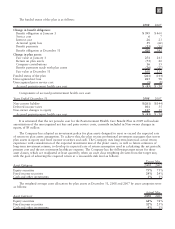
Stockholders’ Equity
Derivative instruments activity, net of tax, included in Non-owner changes to equity within the consolidated
statements of stockholders’ equity for the years ended December 31, 2008, 2007 and 2006 is as follows:
2008 2007 2006
Balance at January 1 $— $ 16 $ 2
Increase (decrease) in fair value (9) (6) 75
Reclassifications to earnings 2(10) (61)
Balance at December 31 $(7) $— $16
Net Investment in Foreign Operations Hedge
At December 31, 2008 and 2007, the Company did not have any hedges of foreign currency exposure of net
investments in foreign operations.
Investments Hedge
During the first quarter of 2006, the Company entered into a zero-cost collar derivative (the “Sprint Nextel
Derivative”) to protect itself economically against price fluctuations in its 37.6 million shares of Sprint Nextel
Corporation (“Sprint Nextel”) non-voting common stock. During the second quarter of 2006, as a result of Sprint
Nextel’s spin-off of Embarq Corporation through a dividend to Sprint Nextel shareholders, the Company received
approximately 1.9 million shares of Embarq Corporation. The floor and ceiling prices of the Sprint Nextel
Derivative were adjusted accordingly. The Sprint Nextel Derivative was not designated as a hedge under the
provisions of SFAS No. 133, “Accounting for Derivative Instruments and Hedging Activities.” Accordingly, to
reflect the change in fair value of the Sprint Nextel Derivative, the Company recorded a net gain of $99 million for
the year ended December 31, 2006, included in Other income (expense) in the Company’s consolidated statements
of operations. In December 2006, the Sprint Nextel Derivative was terminated and settled in cash and the
37.6 million shares of Sprint Nextel were converted to common shares and sold. The Company received aggregate
cash proceeds of approximately $820 million from the settlement of the Sprint Nextel Derivative and the
subsequent sale of the 37.6 million Sprint Nextel shares. The Company recognized a loss of $126 million in
connection with the sale of the remaining shares of Sprint Nextel common stock. As described above, the
Company recorded a net gain of $99 million in connection with the Sprint Nextel Derivative.
Fair Value of Financial Instruments
The Company’s financial instruments include cash equivalents, Sigma Fund investments, short-term
investments, accounts receivable, long-term receivables, accounts payable, accrued liabilities, derivatives and other
financing commitments. The Company’s Sigma Fund, available-for-sale investment portfolios and derivatives are
recorded in the Company’s consolidated balance sheets at fair value. All other financial instruments, with the
exception of long-term debt, are carried at cost, which is not materially different than the instruments’ fair values.
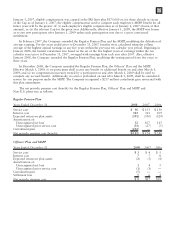
Using quoted market prices and market interest rates, the Company determined that the fair value of long-
term debt at December 31, 2008 was $2.8 billion, compared to a carrying value of $4.1 billion. Since considerable
judgment is required in interpreting market information, the fair value of the long-term debt is not necessarily
indicative of the amount which could be realized in a current market exchange.
Equity Price Market Risk
At December 31, 2008, the Company’s available-for-sale equity securities portfolio had an approximate fair
market value of $128 million, which represented a cost basis of $125 million and a net unrealized loss of
$3 million. These equity securities are held for purposes other than trading.
102