Motorola 2008 Annual Report Download - page 111
Download and view the complete annual report
Please find page 111 of the 2008 Motorola annual report below. You can navigate through the pages in the report by either clicking on the pages listed below, or by using the keyword search tool below to find specific information within the annual report.-
 1
1 -
2
-
3
-
4
-
5
-
6
-
7
-
8
-
9
-
10
-
11
-
12
-
13
-
14
-
15
-
16
-
17
-
18
-
19
-
20
-
21
-
22
-
23
-
24
-
25
-
26
-
27
-
28
-
29
-
30
-
31
-
32
-
33
-
34
-
35
-
36
-
37
-
38
-
39
-
40
-
41
-
42
-
43
-
44
-
45
-
46
-
47
-
48
-
49
-
50
-
51
-
52
-
53
-
54
-
55
-
56
-
57
-
58
-
59
-
60
-
61
-
62
-
63
-
64
-
65
-
66
-
67
-
68
-
69
-
70
-
71
-
72
-
73
-
74
-
75
-
76
-
77
-
78
-
79
-
80
-
81
-
82
-
83
-
84
-
85
-
86
-
87
-
88
-
89
-
90
-
91
-
92
-
93
-
94
-
95
-
96
-
97
-
98
-
99
-
100
-
 101
101 -
 102
102 -
 103
103 -
 104
104 -
 105
105 -
 106
106 -
 107
107 -
 108
108 -
 109
109 -
 110
110 -
 111
111 -
 112
112 -
 113
113 -
 114
114 -
 115
115 -
 116
116 -
 117
117 -
 118
118 -
 119
119 -
 120
120 -
 121
121 -
122
-
123
-
124
-
125
-
126
-
127
-
128
-
129
-
130
-
131
-
132
-
133
-
134
-
135
-
136
-
137
-
138
-
139
-
140
-
141
-
142
-
143
-
144
-
145
-
146
-
147
-
148
-
149
-
150
-
151
-
152
-
153
-
154
-
155
-
156
 |
 |

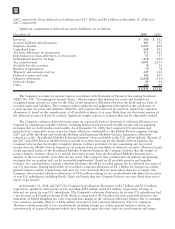
6. Income Taxes
Components of earnings (loss) from continuing operations before income taxes are as follows:
Years Ended December 31 2008 2007 2006
United States $(3,880) $(2,540) $1,034
Other nations 1,243 2,150 3,576
$(2,637) $ (390) $4,610
Components of income tax expense (benefit) are as follows:
Years Ended December 31 2008 2007 2006
United States $ (618) $40 $ 10
Other nations 532 402 488
States (U.S.) (5) 20 13
Current income tax expense (91) 462 511
United States 1,702 (633) 892
Other nations 49 (50) (147)
States (U.S.) (53) (64) 93
Deferred income tax expense (benefit) 1,698 (747) 838
Total income tax expense (benefit) $1,607 $(285) $1,349
Deferred tax charges (benefits) that were recorded within Non-owner changes to equity in the Company’s
consolidated balance sheets resulted from retirement benefit adjustments, currency translation adjustments, net
gains (losses) on derivative instruments and fair value adjustments to available-for-sale securities. The adjustments
were ($738) million, $306 million and $(182) million for the years ended December 31, 2008, 2007 and 2006,
respectively. Except for certain earnings that the Company intends to reinvest indefinitely, provisions have been
made for the estimated U.S. federal income taxes applicable to undistributed earnings of non-U.S. subsidiaries.
Undistributed earnings that the Company intends to reinvest indefinitely, and for which no U.S. federal income
taxes have been provided, aggregate to $2.9 billion, $4.1 billion and $4.0 billion at December 31, 2008, 2007 and
2006, respectively. The portion of earnings not reinvested indefinitely may be distributed without an additional
U.S. federal income tax charge given the U.S. federal tax accrued on undistributed earnings and the utilization of
available foreign tax credits.
Differences between income tax expense (benefit) computed at the U.S. federal statutory tax rate of 35% and
income tax expense (benefit) are as follows:
Years Ended December 31 2008 2007 2006
Income tax expense (benefit) at statutory rate $ (923) $(137) $1,613
Taxes on non-U.S. earnings 125 (206) (449)
State income taxes (38) (28) 77
Valuation allowances 2,321 (97) (187)
Goodwill impairment 555 ——
Tax on undistributed non-U.S. earnings 119 72 194
Other provisions (541) 119 247
Research credits (13) (46) (34)
Non-deductible acquisition charges —34 4
Taxes on sale of businesses —15 —
Tax benefit on qualifying repatriations —— (68)
Charitable contributions —— (28)
Foreign export sales and section 199 deduction —— (22)
Other 2(11) 2
$1,607 $(285) $1,349
Gross deferred tax assets were $9.8 billion and $8.9 billion at December 31, 2008 and 2007, respectively.
Deferred tax assets, net of valuation allowances, were $7.2 billion and $8.4 billion at December 31, 2008 and
103