Motorola 2008 Annual Report Download - page 129
Download and view the complete annual report
Please find page 129 of the 2008 Motorola annual report below. You can navigate through the pages in the report by either clicking on the pages listed below, or by using the keyword search tool below to find specific information within the annual report.-
 1
1 -
2
-
3
-
4
-
5
-
6
-
7
-
8
-
9
-
10
-
11
-
12
-
13
-
14
-
15
-
16
-
17
-
18
-
19
-
20
-
21
-
22
-
23
-
24
-
25
-
26
-
27
-
28
-
29
-
30
-
31
-
32
-
33
-
34
-
35
-
36
-
37
-
38
-
39
-
40
-
41
-
42
-
43
-
44
-
45
-
46
-
47
-
48
-
49
-
50
-
51
-
52
-
53
-
54
-
55
-
56
-
57
-
58
-
59
-
60
-
61
-
62
-
63
-
64
-
65
-
66
-
67
-
68
-
69
-
70
-
71
-
72
-
73
-
74
-
75
-
76
-
77
-
78
-
79
-
80
-
81
-
82
-
83
-
84
-
85
-
86
-
87
-
88
-
89
-
90
-
91
-
92
-
93
-
94
-
95
-
96
-
97
-
98
-
99
-
100
-
101
-
102
-
103
-
104
-
105
-
106
-
107
-
108
-
109
-
110
-
111
-
112
-
113
-
114
-
115
-
116
-
117
-
118
-
 119
119 -
 120
120 -
 121
121 -
 122
122 -
 123
123 -
 124
124 -
 125
125 -
 126
126 -
 127
127 -
 128
128 -
 129
129 -
 130
130 -
 131
131 -
 132
132 -
 133
133 -
 134
134 -
 135
135 -
 136
136 -
 137
137 -
 138
138 -
 139
139 -
140
-
141
-
142
-
143
-
144
-
145
-
146
-
147
-
148
-
149
-
150
-
151
-
152
-
153
-
154
-
155
-
156
 |
 |

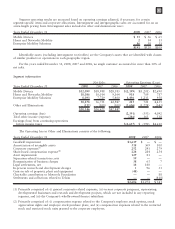
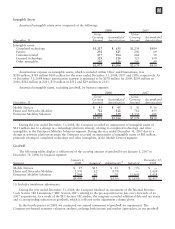
Segment operating results are measured based on operating earnings adjusted, if necessary, for certain
segment-specific items and corporate allocations. Intersegment and intergeographic sales are accounted for on an
arm’s-length pricing basis. Intersegment sales included in other and eliminations were:
Years Ended December 31 2008 2007 2006
Mobile Devices $53 $56 $65
Home and Networks Mobility 214 13
Enterprise Mobility Solutions 86 58 31
$141 $128 $109
Identifiable assets (excluding intersegment receivables) are the Company’s assets that are identified with classes
of similar products or operations in each geographic region.
For the years ended December 31, 2008, 2007 and 2006, no single customer accounted for more than 10% of
net sales.
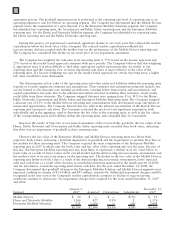
Segment information
Years Ended December 31 2008 2007 2006 2008 2007 2006
Net Sales Operating Earnings (Loss)
Mobile Devices $12,099 $18,988 $28,383 $(2,199) $(1,201) $2,690
Home and Networks Mobility 10,086 10,014 9,164 918 709 787
Enterprise Mobility Solutions 8,093 7,729 5,400 1,496 1,213 958
30,278 36,731 42,947 215 721 4,435
Other and Eliminations (132) (109) (100) (2,606) (1,274) (343)
$30,146 $36,622 $42,847
Operating earnings (loss) (2,391) (553) 4,092
Total other income (expense) (246) 163 518
Earnings (loss) from continuing operations
before income taxes $(2,637) $ (390) $4,610
The Operating loss in Other and Eliminations consists of the following:
Years Ended December 31 2008 2007 2006
Goodwill impairment $1,619 $—$—
Amortization of intangible assets 318 369 100
Corporate expenses
(1)
252 241 279
Share-based compensation expense
(2)
224 284 254
Asset impairments 129 81 —
Separation-related transaction costs 59 ——
Reorganization of business charges 38 63 7
Legal settlements, net 14 140 —
In-process research and development charges 1 96 33
Gain on sale of property, plant and equipment (48) ——
Charitable contribution to Motorola Foundation — — 88
Settlements and collections related to Telsim — — (418)
$2,606 $1,274 $ 343
(1) Primarily comprised of: (i) general corporate-related expenses, (ii) various corporate programs, representing
developmental businesses and research and development projects, which are not included in any reporting
segment, and (iii) the Company’s wholly-owned finance subsidiary.
(2) Primarily comprised of: (i) compensation expense related to the Company’s employee stock options, stock
appreciation rights and employee stock purchase plans, and (ii) compensation expenses related to the restricted
stock and restricted stock units granted to the corporate employees.
121