Motorola 2008 Annual Report Download - page 101
Download and view the complete annual report
Please find page 101 of the 2008 Motorola annual report below. You can navigate through the pages in the report by either clicking on the pages listed below, or by using the keyword search tool below to find specific information within the annual report.-
 1
1 -
2
-
3
-
4
-
5
-
6
-
7
-
8
-
9
-
10
-
11
-
12
-
13
-
14
-
15
-
16
-
17
-
18
-
19
-
20
-
21
-
22
-
23
-
24
-
25
-
26
-
27
-
28
-
29
-
30
-
31
-
32
-
33
-
34
-
35
-
36
-
37
-
38
-
39
-
40
-
41
-
42
-
43
-
44
-
45
-
46
-
47
-
48
-
49
-
50
-
51
-
52
-
53
-
54
-
55
-
56
-
57
-
58
-
59
-
60
-
61
-
62
-
63
-
64
-
65
-
66
-
67
-
68
-
69
-
70
-
71
-
72
-
73
-
74
-
75
-
76
-
77
-
78
-
79
-
80
-
81
-
82
-
83
-
84
-
85
-
86
-
87
-
88
-
89
-
90
-
 91
91 -
 92
92 -
 93
93 -
 94
94 -
 95
95 -
 96
96 -
 97
97 -
 98
98 -
 99
99 -
 100
100 -
 101
101 -
 102
102 -
 103
103 -
 104
104 -
 105
105 -
 106
106 -
 107
107 -
 108
108 -
 109
109 -
 110
110 -
 111
111 -
112
-
113
-
114
-
115
-
116
-
117
-
118
-
119
-
120
-
121
-
122
-
123
-
124
-
125
-
126
-
127
-
128
-
129
-
130
-
131
-
132
-
133
-
134
-
135
-
136
-
137
-
138
-
139
-
140
-
141
-
142
-
143
-
144
-
145
-
146
-
147
-
148
-
149
-
150
-
151
-
152
-
153
-
154
-
155
-
156
 |
 |

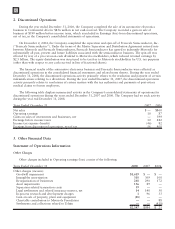
Other Income (Expense)
Interest income, net, and Other both included in Other income (expense) consist of the following:
Years Ended December 31 2008 2007 2006
Interest income, net:
Interest income $ 272 $ 456 $ 661
Interest expense (224) (365) (335)
$48 $ 91 $ 326
Other:
Investment impairments $(365) $ (44) $ (27)
Impairment charges on Sigma Fund investments (186) (18) —
Temporary unrealized losses of the Sigma Fund investments (101) ——
Foreign currency gain (loss) (84) 97 60
U.S. pension plan freeze curtailment gain 237 ——
Liability extinguishment gain 56 ——
Gain on interest rate swaps 24 ——
Gain on Sprint Nextel derivatives ——99
Other 43 (13) 19
$(376) $ 22 $ 151
Earnings (Loss) Per Common Share
Basic and diluted earnings (loss) per common share from both continuing operations and net earnings (loss),
including discontinued operations, is computed as follows:
Years Ended December 31 2008 2007 2006 2008 2007 2006
Continuing Operations Net Earnings (Loss)
Basic earnings (loss) per common share:
Earnings (loss) $ (4,244) $ (105) $ 3,261 $ (4,244) $ (49) $ 3,661
Weighted average common shares outstanding 2,265.4 2,312.7 2,446.3 2,265.4 2,312.7 2,446.3
Per share amount $ (1.87) $ (0.05) $ 1.33 $ (1.87) $ (0.02) $ 1.50
Diluted earnings (loss) per common share:
Earnings (loss) $ (4,244) $ (105) $ 3,261 $ (4,244) $ (49) $ 3,661
Weighted average common shares outstanding 2,265.4 2,312.7 2,446.3 2,265.4 2,312.7 2,446.3
Add effect of dilutive securities:
Employee share-based awards —— 57.9 —— 57.9
Diluted weighted average common shares outstanding 2,265.4 2,312.7 2,504.2 2,265.4 2,312.7 2,504.2
Per share amount $ (1.87) $ (0.05) $ 1.30 $ (1.87) $ (0.02) $ 1.46
For the years ended December 31, 2008 and 2007, the Company was in a loss position and accordingly, the
basic and diluted weighted average shares outstanding are equal because any increase to the basic shares would be
antidilutive. Once the Company returns to profitability, the diluted impact of stock options, stock appreciation
rights, and restricted stock units will be evaluated for their impact on the weighted average shares outstanding for
purposes of computing diluted earnings (loss) per common share.
For the year ended December 31, 2006 in the computation of diluted earnings (loss) per common share from
both continuing operations and on a net earnings (loss) basis, 76.6 million stock options were excluded because
their inclusion would have been antidilutive.
93