Motorola 2008 Annual Report Download - page 125
Download and view the complete annual report
Please find page 125 of the 2008 Motorola annual report below. You can navigate through the pages in the report by either clicking on the pages listed below, or by using the keyword search tool below to find specific information within the annual report.-
 1
1 -
2
-
3
-
4
-
5
-
6
-
7
-
8
-
9
-
10
-
11
-
12
-
13
-
14
-
15
-
16
-
17
-
18
-
19
-
20
-
21
-
22
-
23
-
24
-
25
-
26
-
27
-
28
-
29
-
30
-
31
-
32
-
33
-
34
-
35
-
36
-
37
-
38
-
39
-
40
-
41
-
42
-
43
-
44
-
45
-
46
-
47
-
48
-
49
-
50
-
51
-
52
-
53
-
54
-
55
-
56
-
57
-
58
-
59
-
60
-
61
-
62
-
63
-
64
-
65
-
66
-
67
-
68
-
69
-
70
-
71
-
72
-
73
-
74
-
75
-
76
-
77
-
78
-
79
-
80
-
81
-
82
-
83
-
84
-
85
-
86
-
87
-
88
-
89
-
90
-
91
-
92
-
93
-
94
-
95
-
96
-
97
-
98
-
99
-
100
-
101
-
102
-
103
-
104
-
105
-
106
-
107
-
108
-
109
-
110
-
111
-
112
-
113
-
114
-
 115
115 -
 116
116 -
 117
117 -
 118
118 -
 119
119 -
 120
120 -
 121
121 -
 122
122 -
 123
123 -
 124
124 -
 125
125 -
 126
126 -
 127
127 -
 128
128 -
 129
129 -
 130
130 -
 131
131 -
 132
132 -
 133
133 -
 134
134 -
 135
135 -
136
-
137
-
138
-
139
-
140
-
141
-
142
-
143
-
144
-
145
-
146
-
147
-
148
-
149
-
150
-
151
-
152
-
153
-
154
-
155
-
156
 |
 |

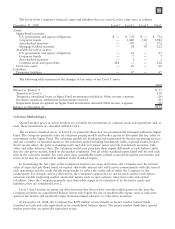
The levels of the Company’s financial assets and liabilities that are carried at fair value were as follows:
December 31, 2008 Level 1 Level 2 Level 3 Total
Assets:
Sigma Fund securities:
U.S. government and agency obligations $ — $ 752 $ — $ 752
Corporate bonds — 1,880 102 1,982
Asset-backed securities — 170 2 172
Mortgage-backed securities — 92 30 122
Available-for-sale securities:
U.S. government and agency obligations — 25 — 25
Corporate bonds — 7 — 7
Asset-backed securities — 1 — 1
Common stock and equivalents 128 — — 128
Derivative assets — 60 — 60
Liabilities:
Derivative liabilities — 67 — 67
The following table summarizes the changes in fair value of our Level 3 assets:
2008
Balance at January 1 $35
Transfers to Level 3 138
Temporary unrealized losses in Sigma Fund investments included in Other income (expense) (16)
Purchases, issuances, settlements and payments received (11)
Impairment losses recognized on Sigma Fund investments included Other income (expense) (12)
Balance at December 31 $134
Valuation Methodologies
Quoted market prices in active markets are available for investments in common stock and equivalents and, as
such, these investments are classified within Level 1.
The securities classified above as Level 2 are primarily those that are professionally managed within the Sigma
Fund. The Company primarily relies on valuation pricing models and broker quotes to determine the fair value of
investments in the Sigma Fund. The valuation models are developed and maintained by third party pricing services
and use a number of standard inputs to the valuation model including benchmark yields, reported trades, broker/
dealer quotes where the party is standing ready and able to transact, issuer spreads, benchmark securities, bids,
offers and other reference data. The valuation model may prioritize these inputs differently at each balance sheet
date for any given security, based on the market conditions. Not all of the standard inputs listed will be used each
time in the valuation models. For each asset class, quantifiable inputs related to perceived market movements and
sector news may be considered in addition to the standard inputs.
In determining the fair value of the Company’s interest rate swap derivatives, the Company uses the present
value of expected cash flows based on market observable interest rate yield curves commensurate with the term of
each instrument and the credit default swap market to reflect the credit risk of either the Company or the
counterparty. For foreign currency derivatives, the Company’s approach is to use forward contract and option
valuation models employing market observable inputs, such as spot currency rates, time value and option
volatilities. Since the Company primarily uses observable inputs in its valuation of its derivative assets and
liabilities, they are considered Level 2.
Level 3 fixed income securities are debt securities that do not have actively traded quotes on the date the
Company presents its consolidated balance sheets and require the use of unobservable inputs, such as indicative
quotes from dealers and qualitative input from investment advisors, to value these securities.
At December 31, 2008, the Company has $499 million of investments in money market mutual funds
classified as Cash and cash equivalents in its consolidated balance sheets. The money market funds have quoted
market prices that are generally equivalent to par.
117