Motorola 2008 Annual Report Download - page 60
Download and view the complete annual report
Please find page 60 of the 2008 Motorola annual report below. You can navigate through the pages in the report by either clicking on the pages listed below, or by using the keyword search tool below to find specific information within the annual report.
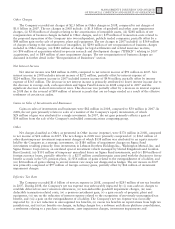
Exit Costs
At January 1, 2006, the Company had an accrual of $50 million for exit costs attributable to lease
terminations. The 2006 additional charges of $30 million were primarily related to a lease cancellation by the
Enterprise Mobility Solutions segment. The 2006 adjustments of $7 million represented reversals of accruals no
longer needed. The $19 million used in 2006 reflects cash payments to lessors. The remaining accrual of
$54 million, which was included in Accrued liabilities in the Company’s consolidated balance sheets at
December 31, 2006, represented future cash payments for lease termination obligations.
Employee Separation Costs
At January 1, 2006, the Company had an accrual of $53 million for employee separation costs, representing
the severance costs for approximately 1,600 employees, of which 1,100 were direct employees and 500 were
indirect employees. The 2006 additional charges of $191 million represented costs for an additional
3,900 employees, of which 1,700 were direct employees and 2,200 were indirect employees. The adjustments of
$16 million represented reversals of accruals no longer needed.
During 2006, approximately 3,200 employees, of which 1,400 were direct employees and 1,800 were indirect
employees, were separated from the Company. The $124 million used in 2006 reflects cash payments to these
separated employees. The remaining accrual of $104 million was included in Accrued liabilities in the Company’s
consolidated balance sheets at December 31, 2006.
Liquidity and Capital Resources
As highlighted in the consolidated statements of cash flows, the Company’s liquidity and available capital
resources are impacted by four key components: (i) current cash and cash equivalents, (ii) operating activities,
(iii) investing activities, and (iv) financing activities.
Cash and Cash Equivalents
At December 31, 2008, the Company’s cash and cash equivalents (which are highly-liquid investments with an
original maturity of three months or less) were $3.1 billion, an increase of $312 million compared to $2.8 billion
at December 31, 2007. At December 31, 2008, $311 million of this amount was held in the U.S. and $2.8 billion
was held by the Company or its subsidiaries in other countries. The Company continues to analyze and review
various repatriation strategies to continue to efficiently repatriate funds. At December 31, 2008, restricted cash
was $343 million (including $279 million held outside of the U.S.), compared to $158 million (including
$91 million held outside of the U.S.) at December 31, 2007.
The Company has approximately $2.9 billion of earnings in foreign subsidiaries that are not permanently
reinvested and may be repatriated without additional U.S. federal income tax charges to the Company’s
consolidated statements of operations, given the U.S. federal tax provisions accrued on undistributed earnings and
the utilization of available foreign tax credits. On a cash basis, these repatriations from the Company’s
non-U.S. subsidiaries could require the payment of additional foreign taxes, which would be creditable against
U.S. federal income taxes. While the Company regularly repatriates funds and a significant portion of the funds
currently offshore can be repatriated quickly with minimal adverse financial impact, repatriation of some of these
funds could be subject to delay for local country approvals and could have potential adverse tax consequences.
Operating Activities
The cash provided by operating activities from continuing operations in 2008 was $242 million, compared to
$785 million provided in 2007, and $3.5 billion provided in 2006. The primary contributors to cash flow from
operations in 2008 were: (i) a $1.9 billion decrease in accounts receivable, (ii) earnings from continuing operations
(adjusted for non-cash items) of $1.0 billion, and (iii) a $466 million decrease in other current assets. These
positive contributors to operating cash flow were partially offset by: (i) a $1.6 billion decrease in accounts payable
and accrued liabilities, (ii) a $1.5 billion net cash outflow due to changes in other assets and liabilities, and (iii) a
$54 million net cash outflow due to changes in inventories.
Accounts Receivable: The Company’s net accounts receivable were $3.5 billion at December 31, 2008,
compared to $5.3 billion at December 31, 2007. The decrease in net accounts receivable reflects a substantial
52 MANAGEMENT’S DISCUSSION AND ANALYSIS
OF FINANCIAL CONDITION AND RESULTS OF OPERATIONS


