Motorola 2008 Annual Report Download - page 122
Download and view the complete annual report
Please find page 122 of the 2008 Motorola annual report below. You can navigate through the pages in the report by either clicking on the pages listed below, or by using the keyword search tool below to find specific information within the annual report.
assumption is based on the Company’s historical expectation of dividend payouts. The expected life of employee
stock options represents the weighted-average period the stock options are expected to remain outstanding based
on the simplified method permitted under Staff Accounting Bulletin No. 110, “Shared-Based Payment”.
The Company has applied a forfeiture rate, estimated based on historical data, of 25%-35% to the option fair
value calculated by the Black-Scholes option pricing model. This estimated forfeiture rate may be revised in
subsequent periods if actual forfeitures differ from this estimate.
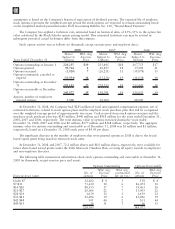
Stock option activity was as follows (in thousands, except exercise price and employee data):
Years Ended December 31
Shares
Subject to
Options
Wtd. Avg.
Exercise
Price
Shares
Subject to
Options
Wtd. Avg.
Exercise
Price
Shares
Subject to
Options
Wtd. Avg.
Exercise
Price
2008 2007 2006
Options outstanding at January 1 224,255 $19 233,445 $18 267,755 $17
Options granted 39,764 8 40,257 18 37,202 21
Options exercised (1,920) 7 (26,211) 11 (59,878) 13
Options terminated, canceled or
expired (33,954) 18 (23,236) 19 (11,634) 19
Options outstanding at December
31 228,145 17 224,255 19 233,445 18
Options exercisable at December
31 148,072 19 138,741 19 135,052 19
Approx. number of employees
granted options 3,300 32,000 28,900
At December 31, 2008, the Company had $283 million of total unrecognized compensation expense, net of
estimated forfeitures, related to stock option plans and the employee stock purchase plan that will be recognized
over the weighted average period of approximately two years. Cash received from stock option exercises and the
employee stock purchase plan was $145 million, $440 million and $918 million for the years ended December 31,
2008, 2007 and 2006, respectively. The total intrinsic value of options exercised during the years ended
December 31, 2008, 2007 and 2006 was $2 million, $177 million and $568 million, respectively. The aggregate
intrinsic value for options outstanding and exercisable as of December 31, 2008 was $1 million and $1 million,
respectively, based on a December 31, 2008 stock price of $4.43 per share.
The significant decrease in the number of employees that were granted options in 2008 is due to the broad
based equity grant being issued in restricted stock units.
At December 31, 2008 and 2007, 72.2 million shares and 88.0 million shares, respectively, were available for
future share-based award grants under the 2006 Motorola Omnibus Plan, covering all equity awards to employees
and non-employee directors.
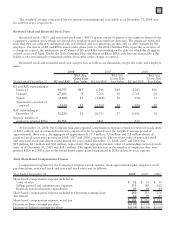
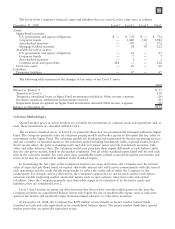
The following table summarizes information about stock options outstanding and exercisable at December 31,
2008 (in thousands, except exercise price and years):
Exercise price range No. of
options
Wtd. avg.
Exercise
Price
Wtd. avg.
contractual
life (in yrs.) No. of
options
Wtd. avg.
Exercise
Price
Options Outstanding Options Exercisable
Under $7 12,602 $ 4 5 538 $ 4
$7-$13 73,630 10 6 46,474 10
$14-$20 88,155 17 7 59,463 16
$21-$27 26,066 22 7 13,905 22
$28-$34 1,659 32 1 1,659 32
$35-$41 25,696 39 6 25,696 39
$42-$48 301 44 2 301 44
$49-$55 36 51 1 36 51
228,145 148,072
114


