Motorola 2008 Annual Report Download - page 131
Download and view the complete annual report
Please find page 131 of the 2008 Motorola annual report below. You can navigate through the pages in the report by either clicking on the pages listed below, or by using the keyword search tool below to find specific information within the annual report.-
 1
1 -
2
-
3
-
4
-
5
-
6
-
7
-
8
-
9
-
10
-
11
-
12
-
13
-
14
-
15
-
16
-
17
-
18
-
19
-
20
-
21
-
22
-
23
-
24
-
25
-
26
-
27
-
28
-
29
-
30
-
31
-
32
-
33
-
34
-
35
-
36
-
37
-
38
-
39
-
40
-
41
-
42
-
43
-
44
-
45
-
46
-
47
-
48
-
49
-
50
-
51
-
52
-
53
-
54
-
55
-
56
-
57
-
58
-
59
-
60
-
61
-
62
-
63
-
64
-
65
-
66
-
67
-
68
-
69
-
70
-
71
-
72
-
73
-
74
-
75
-
76
-
77
-
78
-
79
-
80
-
81
-
82
-
83
-
84
-
85
-
86
-
87
-
88
-
89
-
90
-
91
-
92
-
93
-
94
-
95
-
96
-
97
-
98
-
99
-
100
-
101
-
102
-
103
-
104
-
105
-
106
-
107
-
108
-
109
-
110
-
111
-
112
-
113
-
114
-
115
-
116
-
117
-
118
-
119
-
120
-
 121
121 -
 122
122 -
 123
123 -
 124
124 -
 125
125 -
 126
126 -
 127
127 -
 128
128 -
 129
129 -
 130
130 -
 131
131 -
 132
132 -
 133
133 -
 134
134 -
 135
135 -
 136
136 -
 137
137 -
 138
138 -
 139
139 -
 140
140 -
 141
141 -
142
-
143
-
144
-
145
-
146
-
147
-
148
-
149
-
150
-
151
-
152
-
153
-
154
-
155
-
156
 |
 |

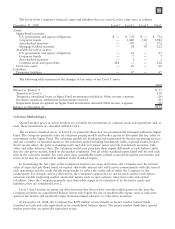
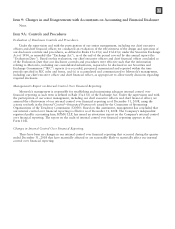
The following table displays the net charges incurred by business segment:
Year Ended December 31, 2008
Mobile Devices $216
Home and Networks Mobility 53
Enterprise Mobility Solutions 27
296
Corporate 38
$334
The following table displays a rollforward of the reorganization of businesses accruals established for exit
costs and employee separation costs from January 1, 2008 to December 31, 2008:
Accruals at
January 1,
2008
2008
Additional
Charges 2008
(1)
Adjustments
2008
Amount
Used
Accruals at
December 31,
2008
Exit costs $ 42 $ 66 $ 1 $ (29) $ 80
Employee separation costs 193 324 (60) (287) 170
$235 $390 $(59) $(316) $250
(1) Includes translation adjustments.
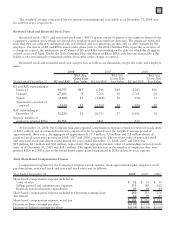
Exit Costs
At January 1, 2008, the Company had an accrual of $42 million for exit costs attributable to lease
terminations. The 2008 additional charges of $66 million are primarily related to: (i) the exit of leased facilities in
the United Kingdom by the Mobile Devices segment, and (ii) the exit of leased facilities in Mexico by the Home
and Networks Mobility segment. The adjustments of $1 million reflect $4 million of translation adjustments,
partially offset by $3 million of reversals of accruals no longer needed. The $29 million used in 2008 reflects cash
payments. The remaining accrual of $80 million, which is included in Accrued liabilities in the Company’s
consolidated balance sheets at December 31, 2008, represents future cash payments, primarily for lease termination
obligations.
Employee Separation Costs
At January 1, 2008, the Company had an accrual of $193 million for employee separation costs, representing
the severance costs for approximately 2,800 employees. The 2008 additional charges of $324 million represent
severance costs for approximately an additional 5,800 employees, of which 2,300 are direct employees and 3,500
are indirect employees.
The adjustments of $60 million reflect $62 million of reversals of accruals no longer needed, partially offset
by $2 million of translation adjustments. The $62 million of reversals represent previously accrued costs for
approximately 600 employees.
During the year ended December 31, 2008, approximately 6,200 employees, of which 3,000 were direct
employees and 3,200 were indirect employees, were separated from the Company. The $287 million used in 2008
reflects cash payments to these separated employees. The remaining accrual of $170 million, which is included in
Accrued liabilities in the Company’s consolidated balance sheets at December 31, 2008, is expected to be paid to
approximately 2,000 employees.
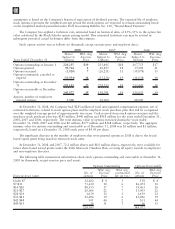
2007 Charges
During the year ended December 31, 2007, the Company committed to implement various productivity
improvement plans aimed at achieving long-term, sustainable profitability by driving efficiencies and reducing
operating costs. All three of the Company’s business segments, as well as corporate functions, are impacted by
these plans. The majority of the employees affected are located in North America and Europe. The Company
recorded net reorganization of business charges of $394 million, including $104 million of charges in Costs of sales
and $290 million of charges under Other charges (income) in the Company’s consolidated statements of
123