Motorola 2008 Annual Report Download - page 117
Download and view the complete annual report
Please find page 117 of the 2008 Motorola annual report below. You can navigate through the pages in the report by either clicking on the pages listed below, or by using the keyword search tool below to find specific information within the annual report.-
 1
1 -
2
-
3
-
4
-
5
-
6
-
7
-
8
-
9
-
10
-
11
-
12
-
13
-
14
-
15
-
16
-
17
-
18
-
19
-
20
-
21
-
22
-
23
-
24
-
25
-
26
-
27
-
28
-
29
-
30
-
31
-
32
-
33
-
34
-
35
-
36
-
37
-
38
-
39
-
40
-
41
-
42
-
43
-
44
-
45
-
46
-
47
-
48
-
49
-
50
-
51
-
52
-
53
-
54
-
55
-
56
-
57
-
58
-
59
-
60
-
61
-
62
-
63
-
64
-
65
-
66
-
67
-
68
-
69
-
70
-
71
-
72
-
73
-
74
-
75
-
76
-
77
-
78
-
79
-
80
-
81
-
82
-
83
-
84
-
85
-
86
-
87
-
88
-
89
-
90
-
91
-
92
-
93
-
94
-
95
-
96
-
97
-
98
-
99
-
100
-
101
-
102
-
103
-
104
-
105
-
106
-
 107
107 -
 108
108 -
 109
109 -
 110
110 -
 111
111 -
 112
112 -
 113
113 -
 114
114 -
 115
115 -
 116
116 -
 117
117 -
 118
118 -
 119
119 -
 120
120 -
 121
121 -
 122
122 -
 123
123 -
 124
124 -
 125
125 -
 126
126 -
 127
127 -
128
-
129
-
130
-
131
-
132
-
133
-
134
-
135
-
136
-
137
-
138
-
139
-
140
-
141
-
142
-
143
-
144
-
145
-
146
-
147
-
148
-
149
-
150
-
151
-
152
-
153
-
154
-
155
-
156
 |
 |

Certain actuarial assumptions such as the discount rate and the long-term rate of return on plan assets have a
significant effect on the amounts reported for net periodic cost and benefit obligation. The assumed discount rates
reflect the prevailing market rates of a universe of high-quality, non-callable, corporate bonds currently available
that, if the obligation were settled at the measurement date, would provide the necessary future cash flows to pay
the benefit obligation when due. The long-term rates of return on plan assets represents an estimate of long-term
returns on an investment portfolio consisting of a mixture of equities, fixed income, cash and other investments
similar to the actual investment mix. In determining the long-term return on plan assets, the Company considers
long-term rates of return on the asset classes (both historical and forecasted) in which the Company expects the
plan funds to be invested.
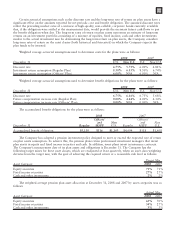
Weighted average actuarial assumptions used to determine costs for the plans were as follows:
December 31 U.S. Non U.S. U.S. Non U.S.
2008 2007
Discount rate 6.75% 5.73% 6.00% 4.81%
Investment return assumption (Regular Plan) 8.50% 6.55% 8.50% 6.74%
Investment return assumption (Officers’ Plan) 6.00% N/A 6.00% N/A
Weighted average actuarial assumptions used to determine benefit obligations for the plans were as follows:
December 31 U.S. Non U.S. U.S. Non U.S.
2008 2007
Discount rate 6.75% 6.16% 6.75% 5.68%
Future compensation increase rate (Regular Plan) 0.00% 4.24% 4.00% 4.34%
Future compensation increase rate (Officers’ Plan) 0.00% N/A 0.00% N/A
The accumulated benefit obligations for the plans were as follows:
December 31 Regular
Officers’
and
MSPP
Non
U.S. Regular
Officers’
and
MSPP Non
U.S.
2008 2007
Accumulated benefit obligation $5,110 $116 $1,163 $4,694 $118 $1,608
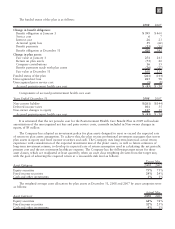
The Company has adopted a pension investment policy designed to meet or exceed the expected rate of return
on plan assets assumption. To achieve this, the pension plans retain professional investment managers that invest
plan assets in equity and fixed income securities and cash. In addition, some plans invest in insurance contracts.
The Company’s measurement date of its plan assets and obligations is December 31. The Company has the
following target mixes for these asset classes, which are readjusted at least quarterly, when an asset class weighting
deviates from the target mix, with the goal of achieving the required return at a reasonable risk level as follows:
Asset Category 2008 2007
Target Mix
Equity securities 71% 71%
Fixed income securities 27% 27%
Cash and other investments 2% 2%
The weighted-average pension plan asset allocation at December 31, 2008 and 2007 by asset categories was as
follows:
Asset Category 2008 2007
Actual Mix
Equity securities 63% 70%
Fixed income securities 34% 27%
Cash and other investments 3% 3%
109