Motorola 2008 Annual Report Download - page 130
Download and view the complete annual report
Please find page 130 of the 2008 Motorola annual report below. You can navigate through the pages in the report by either clicking on the pages listed below, or by using the keyword search tool below to find specific information within the annual report.-
 1
1 -
2
-
3
-
4
-
5
-
6
-
7
-
8
-
9
-
10
-
11
-
12
-
13
-
14
-
15
-
16
-
17
-
18
-
19
-
20
-
21
-
22
-
23
-
24
-
25
-
26
-
27
-
28
-
29
-
30
-
31
-
32
-
33
-
34
-
35
-
36
-
37
-
38
-
39
-
40
-
41
-
42
-
43
-
44
-
45
-
46
-
47
-
48
-
49
-
50
-
51
-
52
-
53
-
54
-
55
-
56
-
57
-
58
-
59
-
60
-
61
-
62
-
63
-
64
-
65
-
66
-
67
-
68
-
69
-
70
-
71
-
72
-
73
-
74
-
75
-
76
-
77
-
78
-
79
-
80
-
81
-
82
-
83
-
84
-
85
-
86
-
87
-
88
-
89
-
90
-
91
-
92
-
93
-
94
-
95
-
96
-
97
-
98
-
99
-
100
-
101
-
102
-
103
-
104
-
105
-
106
-
107
-
108
-
109
-
110
-
111
-
112
-
113
-
114
-
115
-
116
-
117
-
118
-
119
-
 120
120 -
 121
121 -
 122
122 -
 123
123 -
 124
124 -
 125
125 -
 126
126 -
 127
127 -
 128
128 -
 129
129 -
 130
130 -
 131
131 -
 132
132 -
 133
133 -
 134
134 -
 135
135 -
 136
136 -
 137
137 -
 138
138 -
 139
139 -
 140
140 -
141
-
142
-
143
-
144
-
145
-
146
-
147
-
148
-
149
-
150
-
151
-
152
-
153
-
154
-
155
-
156
 |
 |

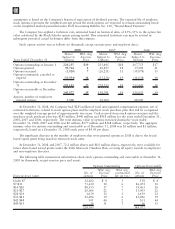
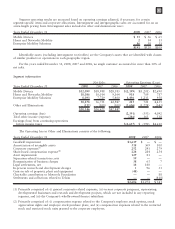
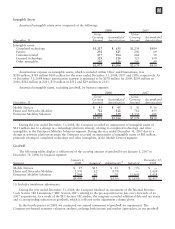
Years Ended December 31 2008 2007 2006 2008 2007 2006 2008 2007 2006
Assets Capital Expenditures Depreciation Expense
Mobile Devices $ 3,559 $ 6,325 $ 9,316 $84 $132 $164 $115 $146 $133
Home and Networks Mobility 7,024 7,451 6,746 147 160 149 135 141 165
Enterprise Mobility Solutions 6,000 8,694 3,268 166 113 190 158 167 92
16,583 22,470 19,330 397 405 503 408 454 390
Other and Eliminations 11,286 12,342 19,263 107 122 146 103 83 73
$27,869 $34,812 $38,593 $504 $527 $649 $511 $537 $463
Assets in Other include primarily cash and cash equivalents, Sigma Fund, deferred income taxes, short-term
investments, property, plant and equipment, investments, and the administrative headquarters of the Company.
Geographic area information
Years Ended December 31 2008 2007 2006 2008 2007 2006 2008 2007 2006
Net Sales
(1)
Assets Property, Plant, and
Equipment
United States $14,708 $18,548 $18,776 $17,938 $22,385 $24,212 $1,240 $1,252 $1,089
China 2,011 2,632 4,664 3,307 3,926 4,649 294 311 278
Brazil 1,554 1,671 1,269 1,057 1,440 1,219 110 109 107
United Kingdom 936 1,070 1,306 1,314 1,305 1,773 85 121 134
Germany 322 516 874 467 644 1,195 57 75 131
Israel 696 741 659 1,268 1,374 1,195 141 165 156
Singapore 116 128 176 1,875 3,120 3,713 32 40 39
Other nations, net of
eliminations 9,803 11,316 15,123 643 618 637 483 407 333
$30,146 $36,622 $42,847 $27,869 $34,812 $38,593 $2,442 $2,480 $2,267
(1) Net sales by geographic region are measured by the locale of end customer.
13. Reorganization of Businesses
The Company maintains a formal Involuntary Severance Plan (the “Severance Plan”), which permits the
Company to offer eligible employees severance benefits based on years of service and employment grade level in
the event that employment is involuntarily terminated as a result of a reduction-in-force or restructuring. The
Company recognizes termination benefits based on formulas per the Severance Plan at the point in time that future
settlement is probable and can be reasonably estimated based on estimates prepared at the time a restructuring
plan is approved by management. Exit costs consist of future minimum lease payments on vacated facilities and
other contractual terminations. At each reporting date, the Company evaluates its accruals for employee separation
and exit costs to ensure the accruals are still appropriate. In certain circumstances, accruals are no longer needed
because of efficiencies in carrying out the plans or because employees previously identified for separation resigned
from the Company and did not receive severance or were redeployed due to circumstances not foreseen when the
original plans were initiated. In these cases, the Company reverses accruals through the consolidated statements of
operations where the original charges were recorded when it is determined they are no longer needed.
2008 Charges
During the year ended December 31, 2008, the Company committed to implement various productivity
improvement plans aimed at achieving long-term, sustainable profitability by driving efficiencies and reducing
operating costs. All three of the Company’s business segments, as well as corporate functions, are impacted by
these plans, with the majority of the impact in the Mobile Devices segment. The employees affected are located in
all regions. The Company recorded net reorganization of business charges of $334 million, including $86 million
of charges in Costs of sales and $248 million of charges under Other charges in the Company’s consolidated
statements of operations. Included in the aggregate $334 million are charges of $324 million for employee
separation costs, $66 million for exit costs and $9 million for fixed asset impairment charges, partially offset by
$65 million of reversals for accruals no longer needed.
122