Motorola 2008 Annual Report Download - page 104
Download and view the complete annual report
Please find page 104 of the 2008 Motorola annual report below. You can navigate through the pages in the report by either clicking on the pages listed below, or by using the keyword search tool below to find specific information within the annual report.-
 1
1 -
2
-
3
-
4
-
5
-
6
-
7
-
8
-
9
-
10
-
11
-
12
-
13
-
14
-
15
-
16
-
17
-
18
-
19
-
20
-
21
-
22
-
23
-
24
-
25
-
26
-
27
-
28
-
29
-
30
-
31
-
32
-
33
-
34
-
35
-
36
-
37
-
38
-
39
-
40
-
41
-
42
-
43
-
44
-
45
-
46
-
47
-
48
-
49
-
50
-
51
-
52
-
53
-
54
-
55
-
56
-
57
-
58
-
59
-
60
-
61
-
62
-
63
-
64
-
65
-
66
-
67
-
68
-
69
-
70
-
71
-
72
-
73
-
74
-
75
-
76
-
77
-
78
-
79
-
80
-
81
-
82
-
83
-
84
-
85
-
86
-
87
-
88
-
89
-
90
-
91
-
92
-
93
-
 94
94 -
 95
95 -
 96
96 -
 97
97 -
 98
98 -
 99
99 -
 100
100 -
 101
101 -
 102
102 -
 103
103 -
 104
104 -
 105
105 -
 106
106 -
 107
107 -
 108
108 -
 109
109 -
 110
110 -
 111
111 -
 112
112 -
 113
113 -
 114
114 -
115
-
116
-
117
-
118
-
119
-
120
-
121
-
122
-
123
-
124
-
125
-
126
-
127
-
128
-
129
-
130
-
131
-
132
-
133
-
134
-
135
-
136
-
137
-
138
-
139
-
140
-
141
-
142
-
143
-
144
-
145
-
146
-
147
-
148
-
149
-
150
-
151
-
152
-
153
-
154
-
155
-
156
 |
 |
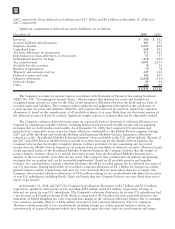
At December 31, 2008, the Company’s available-for-sale equity securities portfolio had an approximate fair
market value of $128 million, which represented a cost basis of $125 million and a net unrealized gain of
$3 million. At December 31, 2007, the Company’s available-for-sale securities portfolio had an approximate fair
market value of $333 million, which represented a cost basis of $372 million and a net unrealized loss of
$39 million.
During the years ended December 31, 2008, 2007 and 2006, the Company recorded investment impairment
charges of $365 million, $44 million and $27 million, respectively, representing other-than-temporary declines in
the value of the Company’s available-for-sale investment portfolio. Investment impairment charges are included in
Other within Other income (expense) in the Company’s consolidated statements of operations.
Gains on sales of investments and businesses, consists of the following:
Years Ended December 31 2008 2007 2006
Gains on sales of investments, net $82 $17 $41
Gains on sales of businesses, net —33 —
$82 $50 $41
During the year ended December 31, 2008, the $82 million of net gains primarily relates to sales of a number
of the Company’s equity investments, of which $29 million of gain was attributed to a single investment. During
the year ended December 31, 2007, the $50 million of net gains was primarily related to a $34 million gain on the
sale of the Company’s embedded communication computing business. During the year ended December 31, 2006,
the $41 million of net gains was primarily related to a $141 million gain on the sale of the Company’s remaining
shares in Telus Corporation, partially offset by a $126 million loss on the sale of the Company’s remaining shares
in Sprint Nextel Corporation (“Sprint Nextel”).
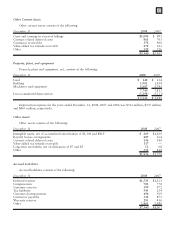
Accounts Receivable
Accounts receivable, net, consists of the following:
December 31 2008 2007
Accounts receivable $3,675 $5,508
Less allowance for doubtful accounts (182) (184)
$3,493 $5,324
Inventories
Inventories, net, consist of the following:
December 31 2008 2007
Finished goods $1,710 $1,737
Work-in-process and production materials 1,709 1,470
3,419 3,207
Less inventory reserves (760) (371)
$2,659 $2,836
During the year ended December 31, 2008, the Company recorded a charge of $291 million for excess
inventory due to a decision to consolidate software and silicon platforms in the Mobile Devices segment.
96