Microsoft 2010 Annual Report Download - page 73
Download and view the complete annual report
Please find page 73 of the 2010 Microsoft annual report below. You can navigate through the pages in the report by either clicking on the pages listed below, or by using the keyword search tool below to find specific information within the annual report.-
 1
1 -
2
-
3
-
4
-
5
-
6
-
7
-
8
-
9
-
10
-
11
-
12
-
13
-
14
-
15
-
16
-
17
-
18
-
19
-
20
-
21
-
22
-
23
-
24
-
25
-
26
-
27
-
28
-
29
-
30
-
31
-
32
-
33
-
34
-
35
-
36
-
37
-
38
-
39
-
40
-
41
-
42
-
43
-
44
-
45
-
46
-
47
-
48
-
49
-
50
-
51
-
52
-
53
-
54
-
55
-
56
-
57
-
58
-
59
-
60
-
61
-
62
-
 63
63 -
 64
64 -
 65
65 -
 66
66 -
 67
67 -
 68
68 -
 69
69 -
 70
70 -
 71
71 -
 72
72 -
 73
73 -
 74
74 -
 75
75 -
 76
76 -
 77
77 -
 78
78 -
 79
79 -
 80
80
 |
 |

72
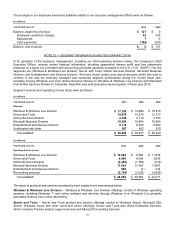
(a) Includes shipments to customers in the United States and licensing to certain OEMs and multinational
organizations.
Revenues from external customers, classified by significant product and service offerings were as follows:
(In millions)
Y
ear Ended June 30, 2010
2009 2008
Microsoft Office system $17,754
$ 17,998 $ 18,083
Windows PC operating systems 18,225
14,653 16,838
Server products and tools 12,007
11,344 10,611
Xbox 360 platform 5,456
5,475 5,598
Consulting and product support services 3,036
3,024 2,743
Advertising 2,528
2,345 2,425
Other 3,478
3,598 4,122
Total $ 62,484
$ 58,437 $ 60,420
Long-lived assets, excluding financial instruments and deferred taxes, classified by the location of the controlling
statutory company, were as follows:
(In millions)
June 30, 2010
2009 2008
United States $18,716
$ 19,362 $ 19,129
Other countries 2,466
2,435 1,194
Total $ 21,182
$ 21,797 $ 20,323
NOTE 23 — QUARTERLY INFORMATION (Unaudited)
(In millions, except per share amounts)
Quarter Ended September 30 December 31 March 31 June 30
Total
Fiscal Year 2010
Revenue $ 12,920 (b) $ 19,022 (a) $ 14,503 $ 16,039 $ 62,484
Gross profit 10,078 15,394 11,748 12,869 50,089
Net income 3,574 6,662 4,006 4,518 18,760
Basic earnings per share 0.40 0.75 0.46 0.52 2.13
Diluted earnings per share 0.40 0.74 0.45 0.51 2.10
Fiscal Year 2009
Revenue $ 15,061 $ 16,629 $ 13,648 $ 13,099 (c) $ 58,437
Gross profit 12,213 12,722 10,834
10,513 46,282
Net income 4,373 4,174 2,977 (d)
3,045 (d) 14,569
Basic earnings per share 0.48 0.47 0.33
0.34 1.63
Diluted earnings per share 0.48 0.47 0.33
0.34 1.62
Fiscal Year 2008
Revenue $ 13,762 $ 16,367 $ 14,454 $ 15,837 $ 60,420
Gross profit 11,087 12,824 11,940
12,971 48,822
Net income 4,289 4,707 4,388 (e)
4,297 17,681
Basic earnings per share 0.46 0.50 0.47
0.46 1.90
Diluted earnings per share 0.45 0.50 0.47
0.46 1.87
(a) Reflects $1.7 billion of revenue recognized for sales of Windows Vista with a guarantee to be upgraded to
Windows 7 at minimal or no cost and of Windows 7 to original equipment manufacturers and retailers before
general availability (the “Windows 7 Deferral”).
(b) Reflects $1.5 billion of revenue deferred to future periods relating to the Windows 7 Deferral.