Microsoft 2010 Annual Report Download - page 22
Download and view the complete annual report
Please find page 22 of the 2010 Microsoft annual report below. You can navigate through the pages in the report by either clicking on the pages listed below, or by using the keyword search tool below to find specific information within the annual report.-
 1
1 -
2
-
3
-
4
-
5
-
6
-
7
-
8
-
9
-
10
-
11
-
 12
12 -
 13
13 -
 14
14 -
 15
15 -
 16
16 -
 17
17 -
 18
18 -
 19
19 -
 20
20 -
 21
21 -
 22
22 -
 23
23 -
 24
24 -
 25
25 -
 26
26 -
 27
27 -
 28
28 -
 29
29 -
 30
30 -
 31
31 -
 32
32 -
33
-
34
-
35
-
36
-
37
-
38
-
39
-
40
-
41
-
42
-
43
-
44
-
45
-
46
-
47
-
48
-
49
-
50
-
51
-
52
-
53
-
54
-
55
-
56
-
57
-
58
-
59
-
60
-
61
-
62
-
63
-
64
-
65
-
66
-
67
-
68
-
69
-
70
-
71
-
72
-
73
-
74
-
75
-
76
-
77
-
78
-
79
-
80
 |
 |

21
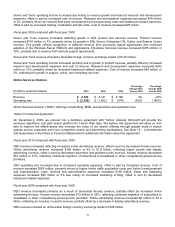
primarily driven by a decrease in corporate marketing activities and headcount-related costs associated with our
corporate sales force.
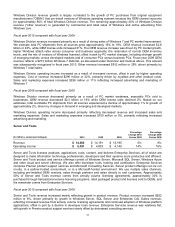
Entertainment and Devices Division
(In millions, except percentages) 2010 2009 2008
Percentage
Change 2010
Versus 2009
Percentage
Change 2009
Versus 2008
Revenue $ 8,058 $ 8,035 $ 8,495
0% (5)%
Operating income $679 $ 108 $ 445 529% (76)%
Entertainment and Devices Division (“EDD”) offerings include the Xbox 360 platform (which includes the Xbox 360
gaming and entertainment console, Xbox 360 video games, Xbox LIVE, and Xbox 360 accessories), the Zune digital
music and entertainment platform (“Zune”), PC software games, online games and services, Mediaroom (our Internet
protocol television software), Windows Phone and Windows Embedded device platforms, application software for
Apple’s Macintosh computers, Microsoft PC hardware products, and other devices. EDD is also responsible for all
retail sales and marketing for Microsoft Office and Windows operating systems.
Fiscal year 2010 compared with fiscal year 2009
EDD revenue was nearly flat reflecting increased revenue from the non-gaming portion of the business, partially
offset by decreased revenue from Xbox 360 platform and PC games. Non-gaming revenue increased $35 million or
1% primarily reflecting increased sales of Windows Embedded device platforms, offset in part by decreased Zune
and Windows Phone revenue. Xbox 360 platform and PC game revenue decreased $12 million, primarily reflecting a
reduction in Xbox 360 consoles sold and revenue per console, offset in part by increased Xbox LIVE revenue. We
shipped 10.3 million Xbox 360 consoles during the fiscal year 2010, compared with 11.2 million Xbox 360 consoles
during fiscal year 2009.
EDD operating income increased due to reduced operating expenses. Cost of revenue decreased $528 million or
11%, primarily due to lower Xbox 360 console costs, offset in part by increased royalty costs resulting from increased
Xbox LIVE digital marketplace third-party content sales and charges resulting from the discontinuation of the KIN
phone. Research and development expenses decreased $34 million or 2%, primarily reflecting decreased third-party
development and programming costs.
Fiscal year 2009 compared with fiscal year 2008
EDD revenue decreased across most lines of business. Revenue from our non-gaming business decreased $300
million or 11%, primarily reflecting decreased Zune and PC hardware product revenue. Xbox 360 platform and PC
game revenue decreased $160 million or 3%, primarily as a result of decreased revenue per Xbox 360 console due
to price reductions during the past 12 months, partially offset by increased Xbox 360 console sales and increased
Xbox LIVE revenue. We shipped 11.2 million Xbox 360 consoles during fiscal year 2009, compared with 8.7 million
Xbox 360 consoles during fiscal year 2008.
EDD revenue included an unfavorable foreign currency exchange impact of $74 million.
EDD operating income decreased primarily due to decreased revenue and increased research and development
expenses, partially offset by decreased cost of revenue. Research and development expenses increased $275
million or 17%, primarily reflecting increased headcount-related expenses associated with the Windows Phone
device platform, driven by recent acquisitions. Cost of revenue decreased $344 million or 7%, primarily due to
decreased Xbox 360 platform costs.
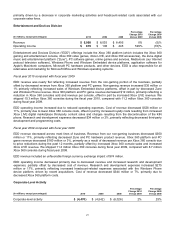
Corporate-Level Activity
(In millions, except percentages) 2010 2009 2008
Percentage
Change 2010
Versus 2009
Percentage
Change 2009
Versus 2008
Corporate-level activity $ (4,470)$ (4,542) $ (6,026) 2% 25%