Microsoft 2010 Annual Report Download - page 53
Download and view the complete annual report
Please find page 53 of the 2010 Microsoft annual report below. You can navigate through the pages in the report by either clicking on the pages listed below, or by using the keyword search tool below to find specific information within the annual report.-
 1
1 -
2
-
3
-
4
-
5
-
6
-
7
-
8
-
9
-
10
-
11
-
12
-
13
-
14
-
15
-
16
-
17
-
18
-
19
-
20
-
21
-
22
-
23
-
24
-
25
-
26
-
27
-
28
-
29
-
30
-
31
-
32
-
33
-
34
-
35
-
36
-
37
-
38
-
39
-
40
-
41
-
42
-
 43
43 -
 44
44 -
 45
45 -
 46
46 -
 47
47 -
 48
48 -
 49
49 -
 50
50 -
 51
51 -
 52
52 -
 53
53 -
 54
54 -
 55
55 -
 56
56 -
 57
57 -
 58
58 -
 59
59 -
 60
60 -
 61
61 -
 62
62 -
 63
63 -
64
-
65
-
66
-
67
-
68
-
69
-
70
-
71
-
72
-
73
-
74
-
75
-
76
-
77
-
78
-
79
-
80
 |
 |

52
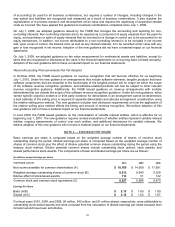
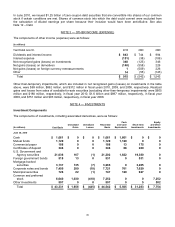
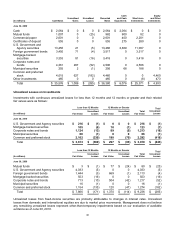
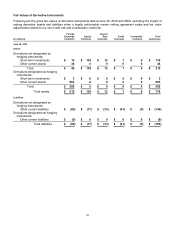
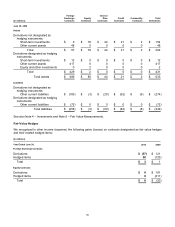
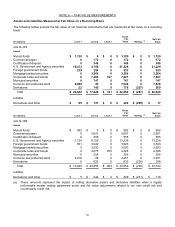
NOTE 6 — FAIR VALUE MEASUREMENTS
Assets and Liabilities Measured at Fair Value on a Recurring Basis
The following tables present the fair value of our financial instruments that are measured at fair value on a recurring
basis:
(In millions) Level 1 Level 2 Level 3
Gross
Fair
Value
Netting (a)
Net Fair
Value
June 30, 2010
Assets
Mutual funds $1,120 $ 0 $ 0 $ 1,120
$ 0 $1,120
Commercial paper 0 172 0 172
0 172
Certificates of deposit 0 348 0 348
0 348
U.S. Government and Agency securities 16,473 4,756 0 21,229
0 21,229
Foreign government bonds 239 294 0 533
0 533
Mortgage-backed securities 0 3,264 0 3,264
0 3,264
Corporate notes and bonds 0 7,460 167 7,627
0 7,627
Municipal securities 0 747 0 747
0 747
Common and preferred stock 6,988 43 5 7,036
0 7,036
Derivatives 22 745 9 776
(207) 569
Total $ 24,842 $ 17,829 $ 181 $ 42,852
$ (207) $ 42,645
Liabilities
Derivatives and other $85 $ 137 $ 0 $ 222
$ (205) $ 17
(In millions) Level 1 Level 2 Level 3
Gross
Fair
Value
Netting (a)
Net Fair
Value
June 30, 2009
Assets
Mutual funds $ 982 $0 $0 $ 982 $ 0 $ 982
Commercial paper 0 2,601 0 2,601
0 2,601
Certificates of deposit 0 555 0 555
0 555
U.S. Government and Agency securities 7,134 6,105 0 13,239
0 13,239
Foreign government bonds 501 3,022 0 3,523
0 3,523
Mortgage-backed securities 0 3,593 0 3,593
0 3,593
Corporate notes and bonds 0 4,073 253 4,326
0 4,326
Municipal securities 0 256 0 256
0 256
Common and preferred stock 4,218 28 5 4,251
0 4,251
Derivatives 5 623 5 633
(235) 398
Total $ 12,840 $ 20,856 $ 263 $ 33,959 $ (235) $ 33,724
Liabilities
Derivatives and other $5 $ 344 $0 $ 349 $ (231) $ 118
(a) These amounts represent the impact of netting derivative assets and derivative liabilities when a legally
enforceable master netting agreement exists and fair value adjustments related to our own credit risk and
counterparty credit risk.