Microsoft 2010 Annual Report Download - page 57
Download and view the complete annual report
Please find page 57 of the 2010 Microsoft annual report below. You can navigate through the pages in the report by either clicking on the pages listed below, or by using the keyword search tool below to find specific information within the annual report.-
 1
1 -
2
-
3
-
4
-
5
-
6
-
7
-
8
-
9
-
10
-
11
-
12
-
13
-
14
-
15
-
16
-
17
-
18
-
19
-
20
-
21
-
22
-
23
-
24
-
25
-
26
-
27
-
28
-
29
-
30
-
31
-
32
-
33
-
34
-
35
-
36
-
37
-
38
-
39
-
40
-
41
-
42
-
43
-
44
-
45
-
46
-
 47
47 -
 48
48 -
 49
49 -
 50
50 -
 51
51 -
 52
52 -
 53
53 -
 54
54 -
 55
55 -
 56
56 -
 57
57 -
 58
58 -
 59
59 -
 60
60 -
 61
61 -
 62
62 -
 63
63 -
 64
64 -
 65
65 -
 66
66 -
 67
67 -
68
-
69
-
70
-
71
-
72
-
73
-
74
-
75
-
76
-
77
-
78
-
79
-
80
 |
 |
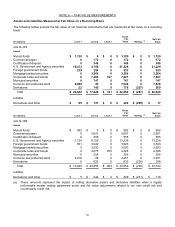
56
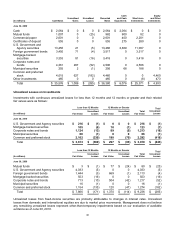
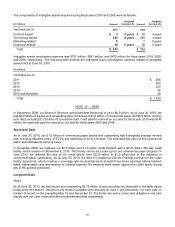
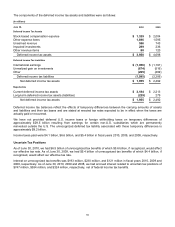
The components of intangible assets acquired during fiscal years 2010 and 2009 were as follows:
(In millions) Amount
Weighted
Average Life
Amount
Weighted
Average Life
Y
ear Ended June 30, 2010 2009
Contract-based $ 3 2 years
$ 26 4 years
Technology-based 322 4 years
293 4 years
Marketing-related 0 7 5 years
Customer-related 18 5 years
28 2 years
Total $ 343 $ 354
Intangible assets amortization expense was $707 million, $591 million, and $472 million for fiscal years 2010, 2009,
and 2008, respectively. The following table outlines the estimated future amortization expense related to intangible
assets held at June 30, 2010:
(In millions)
Y
ear Ending June 30,
2011 $ 486
2012 365
2013 235
2014 36
2015 and thereafter 36
Total $ 1,158
NOTE 12 — DEBT
In September 2008, our Board of Directors authorized debt financings of up to $6.0 billion. As of June 30, 2010, we
had $6.0 billion of issued and outstanding debt comprised of $1.0 billion of commercial paper and $5.0 billion of long-
term debt, including $1.25 billion of convertible debt. Cash paid for interest on our debt for fiscal year 2010 was $145
million. No cash was paid for interest on our debt for fiscal years 2009 and 2008.
Short-term Debt
As of June 30, 2010, our $1.0 billion of commercial paper issued and outstanding had a weighted average interest
rate, including issuance costs, of 0.20% and maturities of 22 to 216 days. The estimated fair value of this commercial
paper approximates its carrying value.
In November 2009, we replaced our $2.0 billion and $1.0 billion credit facilities with a $2.25 billion 364-day credit
facility, which expires on November 5, 2010. This facility serves as a back-up for our commercial paper program. In
June 2010, we reduced the size of our credit facility from $2.25 billion to $1.0 billion due to the reduction in
commercial paper outstanding. As of June 30, 2010, we were in compliance with the financial covenant in the credit
facility agreement, which requires a coverage ratio be maintained of at least three times earnings before interest,
taxes, depreciation, and amortization to interest expense. No amounts were drawn against the credit facility during
any of the periods presented.
Long-term Debt
Notes
As of June 30, 2010, we had issued and outstanding $3.75 billion of debt securities as illustrated in the table below
(collectively “the Notes”). Interest on the Notes is payable semi-annually on June 1 and December 1 of each year, to
holders of record on the preceding May 15 and November 15. The Notes are senior unsecured obligations and rank
equally with our other unsecured and unsubordinated debt outstanding.