Microsoft 2010 Annual Report Download - page 35
Download and view the complete annual report
Please find page 35 of the 2010 Microsoft annual report below. You can navigate through the pages in the report by either clicking on the pages listed below, or by using the keyword search tool below to find specific information within the annual report.-
 1
1 -
2
-
3
-
4
-
5
-
6
-
7
-
8
-
9
-
10
-
11
-
12
-
13
-
14
-
15
-
16
-
17
-
18
-
19
-
20
-
21
-
22
-
23
-
24
-
 25
25 -
 26
26 -
 27
27 -
 28
28 -
 29
29 -
 30
30 -
 31
31 -
 32
32 -
 33
33 -
 34
34 -
 35
35 -
 36
36 -
 37
37 -
 38
38 -
 39
39 -
 40
40 -
 41
41 -
 42
42 -
 43
43 -
 44
44 -
 45
45 -
46
-
47
-
48
-
49
-
50
-
51
-
52
-
53
-
54
-
55
-
56
-
57
-
58
-
59
-
60
-
61
-
62
-
63
-
64
-
65
-
66
-
67
-
68
-
69
-
70
-
71
-
72
-
73
-
74
-
75
-
76
-
77
-
78
-
79
-
80
 |
 |

34
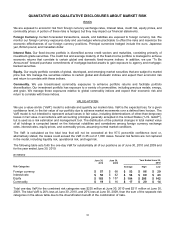
QUANTATIVE AND QUALITATIVE DISCLOSURES ABOUT MARKET RISK
RISKS
We are exposed to economic risk from foreign currency exchange rates, interest rates, credit risk, equity prices, and
commodity prices. A portion of these risks is hedged, but they may impact our financial statements.
Foreign Currency. Certain forecasted transactions, assets, and liabilities are exposed to foreign currency risk. We
monitor our foreign currency exposures daily and use hedges where practicable to offset the risks and maximize the
economic effectiveness of our foreign currency positions. Principal currencies hedged include the euro, Japanese
yen, British pound, and Canadian dollar.
Interest Rate. Our fixed-income portfolio is diversified across credit sectors and maturities, consisting primarily of
investment-grade securities. The credit risk and average maturity of the fixed-income portfolio is managed to achieve
economic returns that correlate to certain global and domestic fixed-income indices. In addition, we use “To Be
Announced” forward purchase commitments of mortgage-backed assets to gain exposure to agency and mortgage-
backed securities.
Equity. Our equity portfolio consists of global, developed, and emerging market securities that are subject to market
price risk. We manage the securities relative to certain global and domestic indices and expect their economic risk
and return to correlate with these indices.
Commodity. We use broad-based commodity exposures to enhance portfolio returns and facilitate portfolio
diversification. Our investment portfolio has exposure to a variety of commodities, including precious metals, energy,
and grain. We manage these exposures relative to global commodity indices and expect their economic risk and
return to correlate with these indices.
VALUE-AT-RISK
We use a value-at-risk (“VaR”) model to estimate and quantify our market risks. VaR is the expected loss, for a given
confidence level, in the fair value of our portfolio due to adverse market movements over a defined time horizon. The
VaR model is not intended to represent actual losses in fair value, including determinations of other-than-temporary
losses in fair value in accordance with accounting principles generally accepted in the United States (“U.S. GAAP”),
but is used as a risk estimation and management tool. The distribution of the potential changes in total market value
of all holdings is computed based on the historical volatilities and correlations among foreign currency exchange
rates, interest rates, equity prices, and commodity prices, assuming normal market conditions.
The VaR is calculated as the total loss that will not be exceeded at the 97.5 percentile confidence level or,
alternatively stated, the losses could exceed the VaR in 25 out of 1,000 cases. Several risk factors are not captured
in the model, including liquidity risk, operational risk, and legal risk.
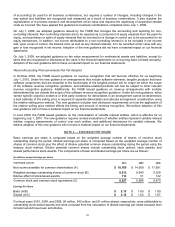
The following table sets forth the one-day VaR for substantially all of our positions as of June 30, 2010 and 2009 and
for the year ended June 30, 2010:
(In millions)
June 30,
2010
June 30,
2009
Y
ear Ended June 30,
2010
Risk Categories Average
High Low
Foreign currency $57 $68 $ 53
$ 86 $ 20
Interest rate $58 $42 $ 54
$ 69 $ 43
Equity $ 183 $ 157 $ 184
$ 206 $ 142
Commodity $19 $16 $ 17
$ 20 $ 14
Total one-day VaR for the combined risk categories was $235 million at June 30, 2010 and $211 million at June 30,
2009. The total VaR is 26% less at June 30, 2010, and 25% less at June 30, 2009, than the sum of the separate risk
categories in the above table due to the diversification benefit of the combination of risks.