Microsoft 2010 Annual Report Download - page 55
Download and view the complete annual report
Please find page 55 of the 2010 Microsoft annual report below. You can navigate through the pages in the report by either clicking on the pages listed below, or by using the keyword search tool below to find specific information within the annual report.-
 1
1 -
2
-
3
-
4
-
5
-
6
-
7
-
8
-
9
-
10
-
11
-
12
-
13
-
14
-
15
-
16
-
17
-
18
-
19
-
20
-
21
-
22
-
23
-
24
-
25
-
26
-
27
-
28
-
29
-
30
-
31
-
32
-
33
-
34
-
35
-
36
-
37
-
38
-
39
-
40
-
41
-
42
-
43
-
44
-
 45
45 -
 46
46 -
 47
47 -
 48
48 -
 49
49 -
 50
50 -
 51
51 -
 52
52 -
 53
53 -
 54
54 -
 55
55 -
 56
56 -
 57
57 -
 58
58 -
 59
59 -
 60
60 -
 61
61 -
 62
62 -
 63
63 -
 64
64 -
 65
65 -
66
-
67
-
68
-
69
-
70
-
71
-
72
-
73
-
74
-
75
-
76
-
77
-
78
-
79
-
80
 |
 |

54
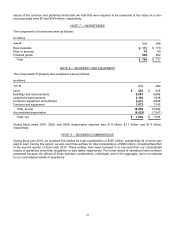
values of the common and preferred stocks that we held that were required to be measured at fair value on a non-
recurring basis were $0 and $164 million, respectively.
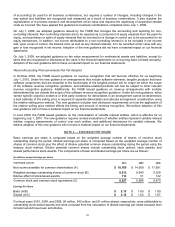
NOTE 7 — INVENTORIES
The components of inventories were as follows:
(In millions)
June 30, 2010 2009
Raw materials $ 172 $ 170
Work in process 16 45
Finished goods 552 502
Total $ 740 $ 717
NOTE 8 — PROPERTY AND EQUIPMENT
The components of property and equipment were as follows:
(In millions)
June 30, 2010 2009
Land $ 526 $ 526
Buildings and improvements 6,087 5,886
Leasehold improvements 2,100 1,938
Computer equipment and software 5,673 4,989
Furniture and equipment 1,873 1,743
Total, at cost 16,259 15,082
Accumulated depreciation (8,629) (7,547)
Total, net $ 7,630 $ 7,535
During fiscal years 2010, 2009, and 2008, depreciation expense was $1.8 billion, $1.7 billion, and $1.4 billion,
respectively.
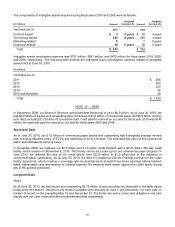
NOTE 9 — BUSINESS COMBINATIONS
During fiscal year 2010, we acquired five entities for total consideration of $267 million, substantially all of which was
paid in cash. During this period, we also sold three entities for total consideration of $600 million, including Razorfish
in the second quarter of fiscal year 2010. These entities have been included in or removed from our consolidated
results of operations since their acquisition or sale dates, respectively. Pro forma results of operations have not been
presented because the effects of these business combinations, individually and in the aggregate, were not material
to our consolidated results of operations.