Microsoft 2010 Annual Report Download - page 48
Download and view the complete annual report
Please find page 48 of the 2010 Microsoft annual report below. You can navigate through the pages in the report by either clicking on the pages listed below, or by using the keyword search tool below to find specific information within the annual report.-
 1
1 -
2
-
3
-
4
-
5
-
6
-
7
-
8
-
9
-
10
-
11
-
12
-
13
-
14
-
15
-
16
-
17
-
18
-
19
-
20
-
21
-
22
-
23
-
24
-
25
-
26
-
27
-
28
-
29
-
30
-
31
-
32
-
33
-
34
-
35
-
36
-
37
-
 38
38 -
 39
39 -
 40
40 -
 41
41 -
 42
42 -
 43
43 -
 44
44 -
 45
45 -
 46
46 -
 47
47 -
 48
48 -
 49
49 -
 50
50 -
 51
51 -
 52
52 -
 53
53 -
 54
54 -
 55
55 -
 56
56 -
 57
57 -
 58
58 -
59
-
60
-
61
-
62
-
63
-
64
-
65
-
66
-
67
-
68
-
69
-
70
-
71
-
72
-
73
-
74
-
75
-
76
-
77
-
78
-
79
-
80
 |
 |

47
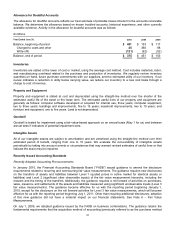
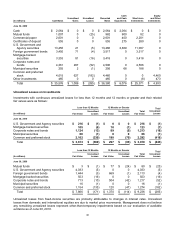
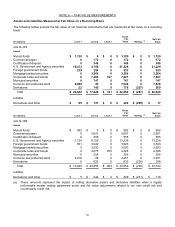
At June 30, 2010 and 2009, the recorded bases and estimated fair values of common and preferred stock and other
investments that are restricted for more than one year or are not publicly traded were $216 million and $204 million,
respectively.
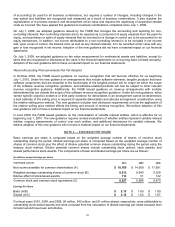
Debt Investment Maturities
(In millions) Cost Basis
Estimated
Fair Value
June 30, 2010
Due in one year or less $ 12,489 $ 12,526
Due after one year through five years 14,987 15,283
Due after five years through 10 years 2,137 2,242
Due after 10 years 3,791 3,952
Total $ 33,404 $ 34,003
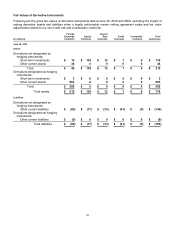
NOTE 5 — DERIVATIVES
We use derivative instruments to manage risks related to foreign currencies, equity prices, interest rates, and credit;
to enhance investment returns; and to facilitate portfolio diversification. Our objectives for holding derivatives include
reducing, eliminating, and efficiently managing the economic impact of these exposures as effectively as possible.
Our derivative programs include strategies that both qualify and do not qualify for hedge accounting treatment. All
notional amounts presented below are measured in U.S. currency equivalents.
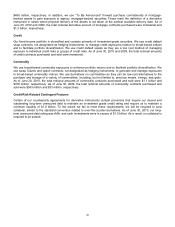
Foreign Currency
Certain forecasted transactions, assets, and liabilities are exposed to foreign currency risk. We monitor our foreign
currency exposures daily to maximize the economic effectiveness of our foreign currency hedge positions. Option
and forward contracts are used to hedge a portion of forecasted international revenue for up to three years in the
future and are designated as cash-flow hedging instruments. Principal currencies hedged include the euro, Japanese
yen, British pound, and Canadian dollar. As of June 30, 2010 and 2009, the total notional amounts of these foreign
exchange contracts sold were $9.3 billion and $7.2 billion, respectively. Foreign currency risks related to certain non-
U.S. dollar denominated securities are hedged using foreign exchange forward contracts that are designated as fair-
value hedging instruments. As of June 30, 2010 and 2009, the total notional amounts of these foreign exchange
contracts sold were $523 million and $3.5 billion, respectively. Certain options and forwards not designated as
hedging instruments are also used to manage the variability in exchange rates on accounts receivable, cash, and
intercompany positions, and to manage other foreign currency exposures. As of June 30, 2010, the total notional
amounts of these foreign exchange contracts purchased and sold were $7.8 billion and $5.3 billion, respectively. As
of June 30, 2009, the total notional amounts of these foreign exchange contracts purchased and sold were $3.2
billion and $3.6 billion, respectively.
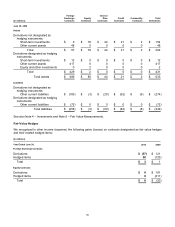
Equity
Securities held in our equity and other investments portfolio are subject to market price risk. Market price risk is
managed relative to broad-based global and domestic equity indices using certain convertible preferred investments,
options, futures, and swap contracts not designated as hedging instruments. From time to time, to hedge our price
risk, we may use and designate equity derivatives as hedging instruments, including puts, calls, swaps, and
forwards. As of June 30, 2010, the total notional amounts of designated and non-designated equity contracts
purchased and sold were $918 million and $472 million, respectively. As of June 30, 2009, the total notional amounts
of designated and non-designated equity contracts purchased and sold were immaterial.
Interest Rate
Securities held in our fixed-income portfolio are subject to different interest rate risks based on their maturities. We
manage the average maturity of our fixed-income portfolio to achieve economic returns that correlate to certain
broad-based fixed-income indices using exchange-traded option and futures contracts and over-the-counter swap
and option contracts, none of which are designated as hedging instruments. As of June 30, 2010, the total notional
amounts of fixed-interest rate contracts purchased and sold were $3.1 billion and $1.8 billion, respectively. As of
June 30, 2009, the total notional amounts of fixed-interest rate contracts purchased and sold were $2.7 billion and