Microsoft 2010 Annual Report Download - page 23
Download and view the complete annual report
Please find page 23 of the 2010 Microsoft annual report below. You can navigate through the pages in the report by either clicking on the pages listed below, or by using the keyword search tool below to find specific information within the annual report.-
 1
1 -
2
-
3
-
4
-
5
-
6
-
7
-
8
-
9
-
10
-
11
-
12
-
 13
13 -
 14
14 -
 15
15 -
 16
16 -
 17
17 -
 18
18 -
 19
19 -
 20
20 -
 21
21 -
 22
22 -
 23
23 -
 24
24 -
 25
25 -
 26
26 -
 27
27 -
 28
28 -
 29
29 -
 30
30 -
 31
31 -
 32
32 -
 33
33 -
34
-
35
-
36
-
37
-
38
-
39
-
40
-
41
-
42
-
43
-
44
-
45
-
46
-
47
-
48
-
49
-
50
-
51
-
52
-
53
-
54
-
55
-
56
-
57
-
58
-
59
-
60
-
61
-
62
-
63
-
64
-
65
-
66
-
67
-
68
-
69
-
70
-
71
-
72
-
73
-
74
-
75
-
76
-
77
-
78
-
79
-
80
 |
 |

22
Certain corporate-level activity is not allocated to our segments, including costs of: broad-based sales and marketing;
product support services; human resources; legal; finance; information technology; corporate development and
procurement activities; research and development; legal settlements and contingencies; and employee severance.
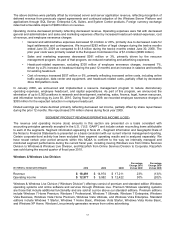
Fiscal year 2010 compared with fiscal year 2009
Corporate-level expenses decreased due mainly to employee severance charges of $330 million incurred in the prior
year, decreased partner payments, and reductions in other costs due to resource management efforts. These
decreases in expenses were offset in part by an increase in legal charges and costs associated with broad-based
sales and marketing activities. Legal charges were approximately $533 million compared to $283 million in the prior
year.
Fiscal year 2009 compared with fiscal year 2008
Corporate-level expenses decreased during fiscal year 2009, primarily reflecting decreased general and
administrative and sales and marketing expenses, partially offset by employee severance charges of $330 million.
General and administrative expenses decreased $1.4 billion or 36%, primarily due to decreased costs for legal
settlements and contingencies. We incurred $283 million of legal charges during fiscal year 2009 as compared to
$1.8 billion during fiscal year 2008. The prior year costs were primarily related to the European Commission fine of
$1.4 billion (€ 899 million). Sales and marketing expenses decreased $513 million or 82%, reflecting the resource
management program implemented in January 2009.
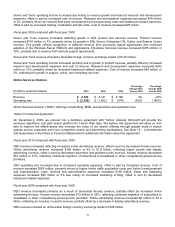
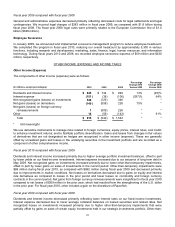
OPERATING EXPENSES
Cost of Revenue
(In millions, except percentages) 2010 2009 2008
Percentage
Change 2010
Versus 2009
Percentage
Change 2009
Versus 2008
Cost of revenue $ 12,395 $ 12,155 $ 11,598 2% 5%
As a percent of revenue 20% 21% 19%
(1)ppt 2ppt
Cost of revenue includes: manufacturing and distribution costs for products sold and programs licensed; operating
costs related to product support service centers and product distribution centers; costs incurred to include software
on PCs sold by OEMs, to drive traffic to our Web sites and to acquire online advertising space (“traffic acquisition
costs”); costs incurred to support and maintain Internet-based products and services; warranty costs; inventory
valuation adjustments; costs associated with the delivery of consulting services; and the amortization of capitalized
research and development costs.
Fiscal year 2010 compared with fiscal year 2009
Cost of revenue increased reflecting higher online costs, mainly Yahoo! reimbursement and implementation costs
and traffic acquisition costs, as well as increased royalty costs resulting from increased Xbox LIVE digital
marketplace third-party content sales and charges resulting from the discontinuation of the KIN phone. For the
current fiscal year, these costs were offset in part by lower Xbox 360 console costs and reductions in other costs due
to resource management efforts.
Fiscal year 2009 compared with fiscal year 2008
Cost of revenue increased during fiscal year 2009, primarily reflecting increased online costs, including traffic
acquisition, data center and equipment, and headcount costs, partially offset by decreased Xbox 360 platform costs.
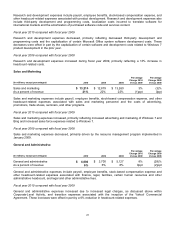
Research and Development
(In millions, except percentages) 2010 2009 2008
Percentage
Change 2010
Versus 2009
Percentage
Change 2009
Versus 2008
Research and development $ 8,714 $ 9,010 $ 8,164 (3)% 10%
As a percent of revenue 14% 15% 14%
(1)ppt 1ppt