Microsoft 2010 Annual Report Download - page 20
Download and view the complete annual report
Please find page 20 of the 2010 Microsoft annual report below. You can navigate through the pages in the report by either clicking on the pages listed below, or by using the keyword search tool below to find specific information within the annual report.-
 1
1 -
2
-
3
-
4
-
5
-
6
-
7
-
8
-
9
-
 10
10 -
 11
11 -
 12
12 -
 13
13 -
 14
14 -
 15
15 -
 16
16 -
 17
17 -
 18
18 -
 19
19 -
 20
20 -
 21
21 -
 22
22 -
 23
23 -
 24
24 -
 25
25 -
 26
26 -
 27
27 -
 28
28 -
 29
29 -
 30
30 -
31
-
32
-
33
-
34
-
35
-
36
-
37
-
38
-
39
-
40
-
41
-
42
-
43
-
44
-
45
-
46
-
47
-
48
-
49
-
50
-
51
-
52
-
53
-
54
-
55
-
56
-
57
-
58
-
59
-
60
-
61
-
62
-
63
-
64
-
65
-
66
-
67
-
68
-
69
-
70
-
71
-
72
-
73
-
74
-
75
-
76
-
77
-
78
-
79
-
80
 |
 |

19
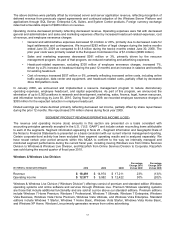
Server and Tools operating income increased due mainly to revenue growth and reduced research and development
expenses, offset in part by increased cost of revenue. Research and development expenses decreased $38 million
or 2%, primarily driven by reduced third-party development and programming costs and headcount-related expenses,
offset in part by increased hosting, localization and lab costs. Cost of revenue increased $25 million.
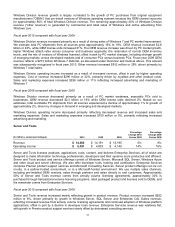
Fiscal year 2009 compared with fiscal year 2008
Server and Tools revenue increased reflecting growth in both product and services revenue. Product revenue
increased $741 million or 7%, primarily driven by growth in SQL Server, Enterprise CAL Suites, and System Center
revenue. This growth reflects recognition of deferred revenue from previously signed agreements and continued
adoption of the Windows Server Platform and applications. Enterprise Services revenue increased $255 million or
10%, primarily due to revenue from annuity support agreements.
Server and Tools revenue included a favorable foreign currency exchange impact of $140 million.
Server and Tools operating income increased primarily due to growth in product revenue, partially offset by increased
research and development expenses and cost of revenue. Research and development expenses increased $242
million or 12%, primarily driven by increased headcount-related expenses. Cost of revenue increased $82 million or
3%, reflecting the growth in support, online, and consulting services.
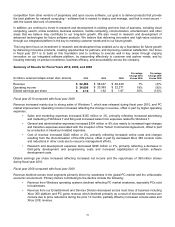
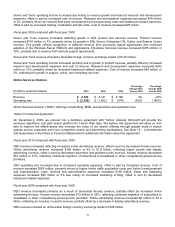
Online Services Division
(In millions, except percentages) 2010 2009 2008
Percentage
Change 2010
Versus 2009
Percentage
Change 2009
Versus 2008
Revenue $ 2,199 $ 2,121 $ 2,198
4% (4)%
Operating loss $(2,355)$ (1,652) $ (578 ) (43)% (186)%
Online Services Division (“OSD”) offerings include Bing, MSN, and advertiser and publisher tools.
Yahoo! Commercial Agreement
On December 4, 2009, we entered into a definitive agreement with Yahoo! whereby Microsoft will provide the
exclusive algorithmic and paid search platform for Yahoo! Web sites. We believe this agreement will allow us over
time to improve the effectiveness and increase the value of our search offering through greater scale in search
queries and an expanded and more competitive search and advertising marketplace. See Note 16 – Commitments
and Guarantees in the Notes to Financial Statements for additional information about the agreement.
Fiscal year 2010 compared with fiscal year 2009
OSD revenue increased reflecting increased online advertising revenue, offset in part by decreased Access revenue.
Online advertising revenue increased $146 million or 8% to $1.9 billion, reflecting higher search and display
advertising revenue, offset in part by decreased advertiser and publisher tools revenue. Access revenue decreased
$57 million or 31%, reflecting continued migration of subscribers to broadband or other competitively-priced service
providers.
OSD operating loss increased due to increased operating expenses, offset in part by increased revenue. Cost of
revenue increased $565 million, primarily driven by higher online traffic acquisition costs and Yahoo! reimbursement
and implementation costs. General and administrative expenses increased $136 million. Sales and marketing
expenses increased $56 million or 5% due mainly to increased marketing of Bing, offset in part by decreased
headcount-related expenses.
Fiscal year 2009 compared with fiscal year 2008
OSD revenue decreased primarily as a result of decreased Access revenue, partially offset by increased online
advertising revenue. Access revenue decreased $72 million or 28%, reflecting continued migration of subscribers to
broadband or other competitively-priced service providers. Online advertising revenue increased $6 million to $1.8
billion, reflecting an increase in search revenue, partially offset by a decrease in display advertising revenue.
OSD revenue included an unfavorable foreign currency exchange impact of $28 million.