Microsoft 2010 Annual Report Download - page 46
Download and view the complete annual report
Please find page 46 of the 2010 Microsoft annual report below. You can navigate through the pages in the report by either clicking on the pages listed below, or by using the keyword search tool below to find specific information within the annual report.-
 1
1 -
2
-
3
-
4
-
5
-
6
-
7
-
8
-
9
-
10
-
11
-
12
-
13
-
14
-
15
-
16
-
17
-
18
-
19
-
20
-
21
-
22
-
23
-
24
-
25
-
26
-
27
-
28
-
29
-
30
-
31
-
32
-
33
-
34
-
35
-
 36
36 -
 37
37 -
 38
38 -
 39
39 -
 40
40 -
 41
41 -
 42
42 -
 43
43 -
 44
44 -
 45
45 -
 46
46 -
 47
47 -
 48
48 -
 49
49 -
 50
50 -
 51
51 -
 52
52 -
 53
53 -
 54
54 -
 55
55 -
 56
56 -
57
-
58
-
59
-
60
-
61
-
62
-
63
-
64
-
65
-
66
-
67
-
68
-
69
-
70
-
71
-
72
-
73
-
74
-
75
-
76
-
77
-
78
-
79
-
80
 |
 |

45
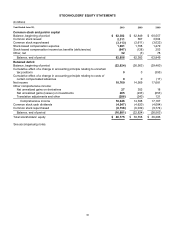
In June 2010, we issued $1.25 billion of zero-coupon debt securities that are convertible into shares of our common
stock if certain conditions are met. Shares of common stock into which the debt could convert were excluded from
the calculation of diluted earnings per share because their inclusion would have been anti-dilutive. See also
Note 12 – Debt.
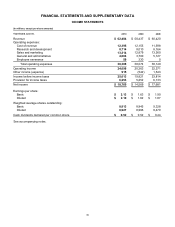
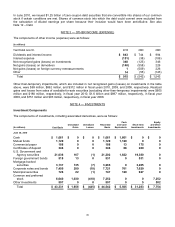
NOTE 3 — OTHER INCOME (EXPENSE)
The components of other income (expense) were as follows:
(In millions)
Y
ear Ended June 30, 2010
2009 2008
Dividends and interest income $ 843
$ 744 $ 994
Interest expense (151 )
(38) (106)
Net recognized gains (losses) on investments 348
(125) 346
Net gains (losses) on derivatives (140 )
(558) 226
Net gains (losses) on foreign currency remeasurements 1
(509) 226
Other 14
(56) (143)
Total $915
$ (542) $ 1,543
Other-than-temporary impairments, which are included in net recognized gains (losses) on investments in the table
above, were $69 million, $862 million, and $312 million in fiscal years 2010, 2009, and 2008, respectively. Realized
gains and losses from sales of available-for-sale securities (excluding other-than-temporary impairments) were $605
million and $188 million, respectively, in fiscal year 2010, $1.6 billion and $897 million, respectively, in fiscal year
2009, and $751 million and $93 million, respectively, in fiscal year 2008.
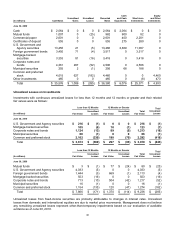
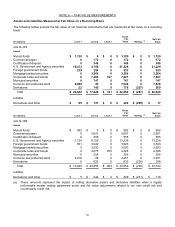
NOTE 4 — INVESTMENTS
Investment Components
The components of investments, including associated derivatives, were as follows:
(In millions) Cost Basis
Unrealized
Gains
Unrealized
Losses
Recorded
Basis
Cash
and Cash
Equivalents
Short-term
Investments
Equity
and Other
Investments
June 30, 2010
Cash $ 1,661
$ 0 $ 0 $ 1,661 $ 1,661
$ 0 $ 0
Mutual funds 1,120
0 0 1,120 1,120
0 0
Commercial paper 188
0 0 188 13
175 0
Certificates of deposit 348
0 0 348 68
280 0
U.S. Government and
Agency securities 21,036
167 (1) 21,202 1,822
19,380 0
Foreign government bonds 518
13 0 531 0
531 0
Mortgage-backed
securities 3,137
135 (7) 3,265 0
3,265 0
Corporate notes and bonds
7,450
289 (18) 7,721 701
7,020 0
Municipal securities 726
22 (1) 747 120
627 0
Common and preferred
stock 6,640
1,030 (418) 7,252 0
0 7,252
Other investments 507
0 0 507 0
5 502
Total $ 43,331
$ 1,656 $ (445) $ 44,542 $ 5,505
$ 31,283 $ 7,754