Microsoft 2010 Annual Report Download - page 17
Download and view the complete annual report
Please find page 17 of the 2010 Microsoft annual report below. You can navigate through the pages in the report by either clicking on the pages listed below, or by using the keyword search tool below to find specific information within the annual report.-
 1
1 -
2
-
3
-
4
-
5
-
6
-
 7
7 -
 8
8 -
 9
9 -
 10
10 -
 11
11 -
 12
12 -
 13
13 -
 14
14 -
 15
15 -
 16
16 -
 17
17 -
 18
18 -
 19
19 -
 20
20 -
 21
21 -
 22
22 -
 23
23 -
 24
24 -
 25
25 -
 26
26 -
 27
27 -
28
-
29
-
30
-
31
-
32
-
33
-
34
-
35
-
36
-
37
-
38
-
39
-
40
-
41
-
42
-
43
-
44
-
45
-
46
-
47
-
48
-
49
-
50
-
51
-
52
-
53
-
54
-
55
-
56
-
57
-
58
-
59
-
60
-
61
-
62
-
63
-
64
-
65
-
66
-
67
-
68
-
69
-
70
-
71
-
72
-
73
-
74
-
75
-
76
-
77
-
78
-
79
-
80
 |
 |

16
competition from other vendors of proprietary and open source software, our goal is to deliver products that provide
the best platform for network computing – software that is easiest to deploy and manage, and that is most secure –
with the lowest total cost of ownership.
In addition, we continue to invest in research and development in existing and new lines of business, including cloud
computing, search, online solutions, business solutions, mobile computing, communication, entertainment, and other
areas that we believe may contribute to our long-term growth. We also invest in research and development of
advanced technologies for future software products. We believe that delivering innovative and high-value solutions
through our integrated platform is the key to meeting customer needs and to our future growth.
This long-term focus on investment in research and development has enabled us to lay a foundation for future growth
by delivering innovative products, creating opportunities for partners, and improving customer satisfaction. Our focus
in fiscal year 2011 is to build on this foundation and to continue to execute well in key areas through ongoing
innovation on our integrated software platform, by responding effectively to customer and partner needs, and by
focusing internally on product excellence, business efficacy, and accountability across the company.
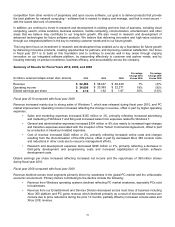
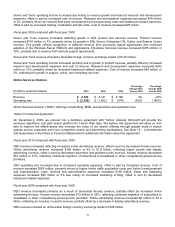
Summary of Results for Fiscal Years 2010, 2009, and 2008
(In millions, except percentages and per share amounts) 2010 2009 2008
Percentage
Change 2010
Versus 2009
Percentage
Change 2009
Versus 2008
Revenue $ 62,484 $ 58,437 $ 60,420
7% (3)%
Operating income $24,098 $ 20,363 $ 22,271 18% (9)%
Diluted earnings per share $2.10 $1.62 $ 1.87 30% (13)%
Fiscal year 2010 compared with fiscal year 2009
Revenue increased mainly due to strong sales of Windows 7, which was released during fiscal year 2010, and PC
market improvement. Operating income increased reflecting the change in revenue, offset in part by higher operating
expenses.
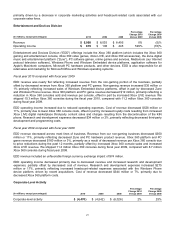
• Sales and marketing expenses increased $335 million or 3%, primarily reflecting increased advertising
and marketing of Windows 7 and Bing and increased sales force expenses related to Windows 7.
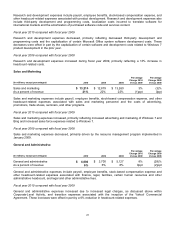
• General and administrative expenses increased $304 million or 8% due mainly to increased legal charges
and transition expenses associated with the inception of the Yahoo! Commercial Agreement, offset in part
by a reduction in headcount-related expenses.
• Cost of revenue increased $240 million or 2%, primarily reflecting increased online costs and charges
resulting from the discontinuation of the KIN phone, offset in part by decreased Xbox 360 console costs
and reductions in other costs due to resource management efforts.
• Research and development expenses decreased $296 million or 3%, primarily reflecting a decrease in
third-party development and programming costs and increased capitalization of certain software
development costs.
Diluted earnings per share increased reflecting increased net income and the repurchase of 380 million shares
during fiscal year 2010.
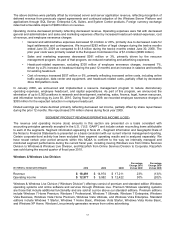
Fiscal year 2009 compared with fiscal year 2008
Revenue declined across most segments primarily driven by weakness in the global PC market and the unfavorable
economic environment. Primary factors contributing to the decline include the following:
• Revenue from Windows operating systems declined reflecting PC market weakness, especially PCs sold
to businesses.
• Revenue from our Entertainment and Devices Division decreased across most lines of business including
Xbox 360 platform and PC game revenue which declined primarily as a result of decreased revenue per
console due to price reductions during the prior 12 months, partially offset by increased console sales and
Xbox LIVE revenue.