Microsoft 2010 Annual Report Download - page 18
Download and view the complete annual report
Please find page 18 of the 2010 Microsoft annual report below. You can navigate through the pages in the report by either clicking on the pages listed below, or by using the keyword search tool below to find specific information within the annual report.-
 1
1 -
2
-
3
-
4
-
5
-
6
-
7
-
 8
8 -
 9
9 -
 10
10 -
 11
11 -
 12
12 -
 13
13 -
 14
14 -
 15
15 -
 16
16 -
 17
17 -
 18
18 -
 19
19 -
 20
20 -
 21
21 -
 22
22 -
 23
23 -
 24
24 -
 25
25 -
 26
26 -
 27
27 -
 28
28 -
29
-
30
-
31
-
32
-
33
-
34
-
35
-
36
-
37
-
38
-
39
-
40
-
41
-
42
-
43
-
44
-
45
-
46
-
47
-
48
-
49
-
50
-
51
-
52
-
53
-
54
-
55
-
56
-
57
-
58
-
59
-
60
-
61
-
62
-
63
-
64
-
65
-
66
-
67
-
68
-
69
-
70
-
71
-
72
-
73
-
74
-
75
-
76
-
77
-
78
-
79
-
80
 |
 |

17
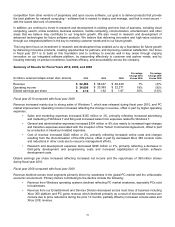
The above declines were partially offset by increased server and server application revenue, reflecting recognition of
deferred revenue from previously signed agreements and continued adoption of the Windows Server Platform and
applications through SQL Server, Enterprise CAL Suites, and System Center products. Foreign currency exchange
rates had a favorable impact of $486 million on revenue.
Operating income decreased primarily reflecting decreased revenue. Operating expenses were flat with decreased
general and administrative and sales and marketing expenses offset by increased headcount-related expenses, cost
of revenue, and employee severance charges.
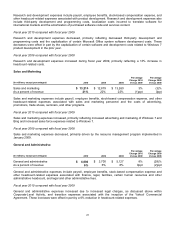
• General and administrative expenses decreased $1.4 billion or 28%, primarily due to decreased costs for
legal settlements and contingencies. We incurred $283 million of legal charges during the twelve months
ended June 30, 2009 as compared to $1.8 billion during the twelve months ended June 30, 2008. The
prior year costs were primarily related to the European Commission fine of $1.4 billion (€899 million).
• Sales and marketing expenses decreased $381 million or 3%, primarily driven by the resource
management program. As part of that program, we reduced marketing and advertising expenses.
• Headcount-related expenses, excluding $330 million of employee severance charges, increased 7%,
driven by a 2% increase in headcount during the past 12 months and an increase in salaries and benefits
for existing headcount.
• Cost of revenue increased $557 million or 5%, primarily reflecting increased online costs, including online
traffic acquisition, data center and equipment, and headcount-related costs, partially offset by decreased
Xbox 360 platform costs.
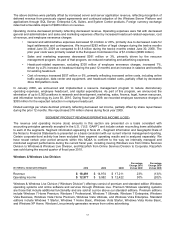
In January 2009, we announced and implemented a resource management program to reduce discretionary
operating expenses, employee headcount, and capital expenditures. As part of this program, we announced the
elimination of up to 5,000 positions in research and development, marketing, sales, finance, legal, human resources,
and information technology by June 30, 2010. During fiscal year 2009, we recorded employee severance charges of
$330 million for the expected reduction in employee headcount.
Diluted earnings per share declined primarily reflecting decreased net income, partially offset by share repurchases
during the prior 12 months. We repurchased 318 million shares during fiscal year 2009.
SEGMENT PRODUCT REVENUE/OPERATING INCOME (LOSS)
The revenue and operating income (loss) amounts in this section are presented on a basis consistent with
accounting principles generally accepted in the U.S. (“U.S. GAAP”) and include certain reconciling items attributable
to each of the segments. Segment information appearing in Note 22 – Segment Information and Geographic Data of
the Notes to Financial Statements is presented on a basis consistent with our current internal management reporting.
Certain corporate-level activity has been excluded from segment operating results and is analyzed separately. We
have recast certain prior period amounts within this MD&A to conform to the way we internally managed and
monitored segment performance during the current fiscal year, including moving Windows Live from Online Services
Division to Windows & Windows Live Division, and Razorfish from Online Services Division to Corporate. Razorfish
was sold during the second quarter of fiscal year 2010.
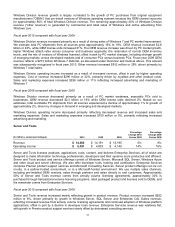
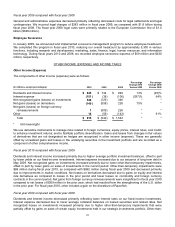
Windows & Windows Live Division
(In millions, except percentages) 2010 2009 2008
Percentage
Change 2010
Versus 2009
Percentage
Change 2009
Versus 2008
Revenue $ 18,491 $ 14,974 $ 17,211
23% (13)%
Operating income $12,977 $ 9,982 $ 12,422 30% (20)%
Windows & Windows Live Division (“Windows Division”) offerings consist of premium and standard edition Windows
operating systems and online software and services through Windows Live. Premium Windows operating systems
are those that include additional functionality and are sold at a price above our standard editions. Premium editions
include Windows 7 Home Premium, Windows 7 Professional, Windows 7 Ultimate, Windows 7 Enterprise, Windows
Vista Business, Windows Vista Home Premium, Windows Vista Ultimate, and Windows Vista Enterprise. Standard
editions include Windows 7 Starter, Windows 7 Home Basic, Windows Vista Starter, Windows Vista Home Basic,
and Windows XP Home. Windows Live primarily generates revenue from online advertising.