Microsoft 2010 Annual Report Download - page 71
Download and view the complete annual report
Please find page 71 of the 2010 Microsoft annual report below. You can navigate through the pages in the report by either clicking on the pages listed below, or by using the keyword search tool below to find specific information within the annual report.-
 1
1 -
2
-
3
-
4
-
5
-
6
-
7
-
8
-
9
-
10
-
11
-
12
-
13
-
14
-
15
-
16
-
17
-
18
-
19
-
20
-
21
-
22
-
23
-
24
-
25
-
26
-
27
-
28
-
29
-
30
-
31
-
32
-
33
-
34
-
35
-
36
-
37
-
38
-
39
-
40
-
41
-
42
-
43
-
44
-
45
-
46
-
47
-
48
-
49
-
50
-
51
-
52
-
53
-
54
-
55
-
56
-
57
-
58
-
59
-
60
-
 61
61 -
 62
62 -
 63
63 -
 64
64 -
 65
65 -
 66
66 -
 67
67 -
 68
68 -
 69
69 -
 70
70 -
 71
71 -
 72
72 -
 73
73 -
 74
74 -
 75
75 -
 76
76 -
 77
77 -
 78
78 -
 79
79 -
 80
80
 |
 |

70
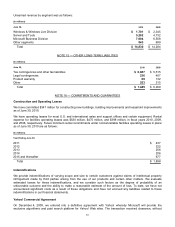
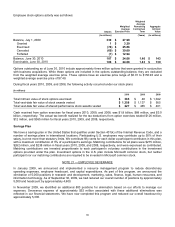
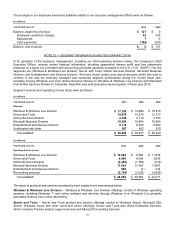
The changes in our employee severance liabilities related to our resource management efforts were as follows:
(In millions)
Y
ear Ended June 30, 2010 2009
Balance, beginning of period $ 127 $0
Employee severance charges 52 330
Adjustments 7 0
Cash payments (186) (203)
Balance, end of period $ 0 $ 127
NOTE 22 — SEGMENT INFORMATION AND GEOGRAPHIC DATA
In its operation of the business, management, including our chief operating decision maker, the Company’s Chief
Executive Officer, reviews certain financial information, including segmented internal profit and loss statements
prepared on a basis not consistent with accounting principles generally accepted in the U.S. (“U.S. GAAP”). Our five
segments are Windows & Windows Live Division; Server and Tools; Online Services Division; Microsoft Business
Division; and Entertainment and Devices Division. We have recast certain prior period amounts within this note to
conform to the way we internally managed and monitored segment performance during the current fiscal year,
including moving Windows Live from Online Services Division to Windows & Windows Live Division and Razorfish
from Online Services Division to Corporate. Razorfish was sold during the second quarter of fiscal year 2010.
Segment revenue and operating income (loss) were as follows:
(In millions)
Y
ear Ended June 30, 2010
2009 2008
Revenue
Windows & Windows Live Division $17,788
$ 14,690 $ 16,815
Server and Tools 14,878
14,276 13,217
Online Services Division 2,198
2,110 2,164
Microsoft Business Division 18,909
18,864 18,904
Entertainment and Devices Division 8,114
8,035 8,502
Unallocated and other 597
462 818
Consolidated $ 62,484
$ 58,437 $ 60,420
(In millions)
Y
ear Ended June 30, 2010
2009 2008
Operating Income (Loss)
Windows & Windows Live Division $12,089
$ 9,569 $ 11,876
Server and Tools 4,990
4,638 3,845
Online Services Division (2,436 )
(1,760) (619)
Microsoft Business Division 11,664
11,454 11,681
Entertainment and Devices Division 589
(3) 314
Reconciling amounts (2,798 )
(3,535) (4,826)
Consolidated $ 24,098
$ 20,363 $ 22,271
The types of products and services provided by each segment are summarized below:
Windows & Windows Live Division – Windows & Windows Live Division offerings consist of Windows operating
systems, including Windows 7, and online software and services through Windows Live. Windows Live primarily
generates revenue from online advertising.
Server and Tools – Server and Tools product and service offerings consist of Windows Server, Microsoft SQL
Server, Windows Azure and other cloud and server offerings. Server and Tools also offers Enterprise Services,
which comprise Premier product support services and Microsoft Consulting Services.