Microsoft 2010 Annual Report Download - page 58
Download and view the complete annual report
Please find page 58 of the 2010 Microsoft annual report below. You can navigate through the pages in the report by either clicking on the pages listed below, or by using the keyword search tool below to find specific information within the annual report.-
 1
1 -
2
-
3
-
4
-
5
-
6
-
7
-
8
-
9
-
10
-
11
-
12
-
13
-
14
-
15
-
16
-
17
-
18
-
19
-
20
-
21
-
22
-
23
-
24
-
25
-
26
-
27
-
28
-
29
-
30
-
31
-
32
-
33
-
34
-
35
-
36
-
37
-
38
-
39
-
40
-
41
-
42
-
43
-
44
-
45
-
46
-
47
-
 48
48 -
 49
49 -
 50
50 -
 51
51 -
 52
52 -
 53
53 -
 54
54 -
 55
55 -
 56
56 -
 57
57 -
 58
58 -
 59
59 -
 60
60 -
 61
61 -
 62
62 -
 63
63 -
 64
64 -
 65
65 -
 66
66 -
 67
67 -
 68
68 -
69
-
70
-
71
-
72
-
73
-
74
-
75
-
76
-
77
-
78
-
79
-
80
 |
 |
57
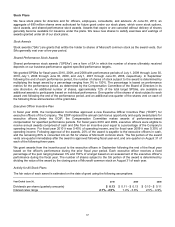
Convertible Debt
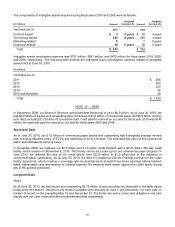
In June 2010, we issued $1.25 billion of zero coupon convertible unsecured debt due on June 15, 2013 in a private
placement offering. Proceeds from the offering were $1.24 billion, net of fees and expenses which were capitalized.
The majority of the proceeds were used to repay outstanding commercial paper, leaving $1.0 billion of commercial
paper outstanding as of June 30, 2010. Each $1,000 principal amount of notes is convertible into 29.94 shares of
Microsoft common stock at a conversion price of $33.40 per share.
Prior to March 15, 2013, the notes will be convertible, only in certain circumstances, into cash and, if applicable,
cash, shares of Microsoft’s common stock or a combination thereof, at our election. On or after March 15, 2013, the
notes will be convertible at any time. Upon conversion, we will pay cash up to the aggregate principal amount of the
notes and pay or deliver cash, shares of our common stock or a combination of cash and shares of our common
stock, at our election.
Because the convertible debt may be wholly or partially settled in cash, we are required to separately account for the
liability and equity components of the notes in a manner that reflects our nonconvertible debt borrowing rate when
interest costs are recognized in subsequent periods. The net proceeds of $1.24 billion were allocated between debt
for $1.18 billion and stockholders’ equity for $58 million with the portion in stockholders’ equity representing the fair
value of the option to convert the debt.
In connection with the issuance of the notes, we entered into capped call transactions with certain option
counterparties who are initial purchasers of the notes or their affiliates. The capped call transactions are expected to
reduce potential dilution of earnings per share upon conversion of the notes. Under the capped call transactions, we
purchased from the option counterparties capped call options that in the aggregate relate to the total number of
shares of our common stock underlying the notes, with a strike price equal to the conversion price of the notes and
with a cap price equal to $37.16. The purchased capped calls were valued at $40 million and recorded to
stockholders’ equity.
As of June 30, 2010, the total carrying value and estimated fair value of our long-term debt, including convertible
debt, were $4.94 billion and $5.21 billion, respectively. The estimate of fair value is based on quoted prices for our
publicly-traded debt as of June 30, 2010, as applicable. The effective interest yields of the Notes due in 2014, 2019,
and 2039 were 3.00%, 4.29%, and 5.22%, respectively, at June 30, 2010. The effective interest yield of the
convertible debt due in 2013 is 1.85% at June 30, 2010 and the coupon interest rate is zero percent.
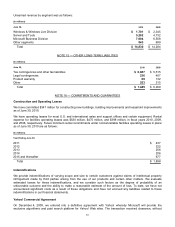
The components of long-term debt as of June 30, 2010 were as follows:
(In millions)
Zero coupon convertible notes due on June 15, 2013 $1,250
2.95% Notes due on June 1, 2014 2,000
4.20% Notes due on June 1, 2019 1,000
5.20% Notes due on June 1, 2039 750
Unamortized discount for Notes above (61)
Total $ 4,939
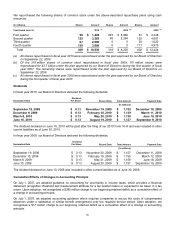
Maturities of long-term debt for the next five years are as follows:
(In millions)
Y
ear Ending June 30,
2011 $0
2012 0
2013 1,250
2014 2,000
2015 0
Thereafter 1,750
Total $ 5,000