Microsoft 2010 Annual Report Download - page 29
Download and view the complete annual report
Please find page 29 of the 2010 Microsoft annual report below. You can navigate through the pages in the report by either clicking on the pages listed below, or by using the keyword search tool below to find specific information within the annual report.-
 1
1 -
2
-
3
-
4
-
5
-
6
-
7
-
8
-
9
-
10
-
11
-
12
-
13
-
14
-
15
-
16
-
17
-
18
-
 19
19 -
 20
20 -
 21
21 -
 22
22 -
 23
23 -
 24
24 -
 25
25 -
 26
26 -
 27
27 -
 28
28 -
 29
29 -
 30
30 -
 31
31 -
 32
32 -
 33
33 -
 34
34 -
 35
35 -
 36
36 -
 37
37 -
 38
38 -
 39
39 -
40
-
41
-
42
-
43
-
44
-
45
-
46
-
47
-
48
-
49
-
50
-
51
-
52
-
53
-
54
-
55
-
56
-
57
-
58
-
59
-
60
-
61
-
62
-
63
-
64
-
65
-
66
-
67
-
68
-
69
-
70
-
71
-
72
-
73
-
74
-
75
-
76
-
77
-
78
-
79
-
80
 |
 |

28
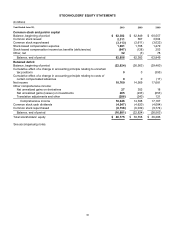
During the periods reported, we repurchased with cash resources: 380 million shares for $10.8 billion during fiscal
year 2010; 318 million shares for $8.2 billion during fiscal year 2009; and 402 million shares for $12.4 billion during
fiscal year 2008. All shares repurchased in fiscal year 2010 were repurchased under the 2008 Program, while all
shares repurchased in fiscal year 2008 were repurchased under the 2007 Programs. Of the shares repurchased in
fiscal year 2009, 101 million shares were repurchased for $2.7 billion under the 2007 Programs, while the remainder
were repurchased under the 2008 Program.
Dividends
During fiscal years 2010 and 2009, our Board of Directors declared the following dividends:
Declaration Date
Dividend
Per Share Record Date Total Amount
Payment Date
(In millions)
Fiscal Year 2010
September 18, 2009 $ 0.13 November 19, 2009 $ 1,152
December 10, 2009
December 9, 2009 $ 0.13 February 18, 2010 $ 1,139 March 11, 2010
March 8, 2010 $ 0.13 May 20, 2010 $ 1,130 June 10, 2010
June 16, 2010 $ 0.13 August 19, 2010 $ 1,127 September 9, 2010
Fiscal Year 2009
September 19, 2008 $ 0.13 November 20, 2008 $ 1,157 December 11, 2008
December 10, 2008 $ 0.13 February 19, 2009 $ 1,155 March 12, 2009
March 9, 2009 $ 0.13 May 21, 2009 $ 1,158 June 18, 2009
June 10, 2009 $ 0.13 August 20, 2009 $ 1,157 September 10, 2009
Off-Balance Sheet Arrangements
We provide indemnifications of varying scope and size to certain customers against claims of intellectual property
infringement made by third parties arising from the use of our products and certain other matters. In evaluating
estimated losses on these indemnifications, we consider factors such as the degree of probability of an unfavorable
outcome and our ability to make a reasonable estimate of the amount of loss. To date, we have not encountered
significant costs as a result of these obligations and have not accrued any liabilities related to these indemnifications
in our financial statements.
Contractual Obligations
The following table summarizes the payments due by fiscal year for our outstanding contractual obligations as of
June 30, 2010. We expect to fund these commitments with existing cash and cash equivalents, short-term
investments and cash flows from operations.
(In millions) 2011 2012-2014 2015-2017
2018 and
Thereafter Total
Long-term debt: (a)
Principal payments $0 $ 3,250 $0 $ 1,750 $ 5,000
Interest payments 140 420 243
942 1,745
Construction commitments (b) 347 0 0
0 347
Operating leases (c) 437 784 407
270 1,898
Purchase commitments (d) 3,994 184 0
0 4,178
Other long-term liabilities (e) 0 72 9
1 82
Total contractual obligations $ 4,918 $ 4,710 $ 659
$ 2,963 $ 13,250
(a) See Note 12 – Debt of the Notes to Financial Statements.
(b) These amounts represent commitments for the construction of buildings, building improvements and leasehold
improvements.
(c) These amounts represent undiscounted future minimum rental commitments under noncancellable facilities
leases.