Microsoft 2010 Annual Report Download - page 24
Download and view the complete annual report
Please find page 24 of the 2010 Microsoft annual report below. You can navigate through the pages in the report by either clicking on the pages listed below, or by using the keyword search tool below to find specific information within the annual report.-
 1
1 -
2
-
3
-
4
-
5
-
6
-
7
-
8
-
9
-
10
-
11
-
12
-
13
-
 14
14 -
 15
15 -
 16
16 -
 17
17 -
 18
18 -
 19
19 -
 20
20 -
 21
21 -
 22
22 -
 23
23 -
 24
24 -
 25
25 -
 26
26 -
 27
27 -
 28
28 -
 29
29 -
 30
30 -
 31
31 -
 32
32 -
 33
33 -
 34
34 -
35
-
36
-
37
-
38
-
39
-
40
-
41
-
42
-
43
-
44
-
45
-
46
-
47
-
48
-
49
-
50
-
51
-
52
-
53
-
54
-
55
-
56
-
57
-
58
-
59
-
60
-
61
-
62
-
63
-
64
-
65
-
66
-
67
-
68
-
69
-
70
-
71
-
72
-
73
-
74
-
75
-
76
-
77
-
78
-
79
-
80
 |
 |

23
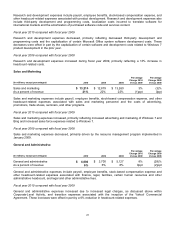
Research and development expenses include payroll, employee benefits, stock-based compensation expense, and
other headcount-related expenses associated with product development. Research and development expenses also
include third-party development and programming costs, localization costs incurred to translate software for
international markets and the amortization of purchased software code and services content.
Fiscal year 2010 compared with fiscal year 2009
Research and development expenses decreased, primarily reflecting decreased third-party development and
programming costs and the capitalization of certain Microsoft Office system software development costs. These
decreases were offset in part by the capitalization of certain software and development costs related to Windows 7
product development in the prior year.
Fiscal year 2009 compared with fiscal year 2008
Research and development expenses increased during fiscal year 2009, primarily reflecting a 13% increase in
headcount-related costs.
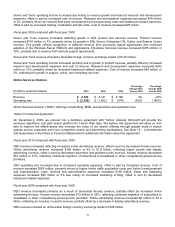
Sales and Marketing
(In millions, except percentages) 2010 2009 2008
Percentage
Change 2010
Versus 2009
Percentage
Change 2009
Versus 2008
Sales and marketing $ 13,214 $ 12,879 $ 13,260
3% (3)%
As a percent of revenue 21% 22% 22%
(1)ppt 0ppt
Sales and marketing expenses include payroll, employee benefits, stock-based compensation expense, and other
headcount-related expenses associated with sales and marketing personnel and the costs of advertising,
promotions, trade shows, seminars, and other programs.
Fiscal year 2010 compared with fiscal year 2009
Sales and marketing expenses increased, primarily reflecting increased advertising and marketing of Windows 7 and
Bing and increased sales force expenses related to Windows 7.
Fiscal year 2009 compared with fiscal year 2008
Sales and marketing expenses decreased, primarily driven by the resource management program implemented in
January 2009.
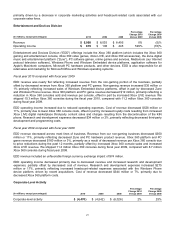
General and Administrative
(In millions, except percentages) 2010 2009 2008
Percentage
Change 2010
Versus 2009
Percentage
Change 2009
Versus 2008
General and administrative $ 4,004 $ 3,700 $ 5,127
8% (28)%
As a percent of revenue 6% 6% 8%
0ppt (2)ppt
General and administrative expenses include payroll, employee benefits, stock-based compensation expense and
other headcount-related expenses associated with finance, legal, facilities, certain human resources and other
administrative headcount, and legal and other administrative fees.
Fiscal year 2010 compared with fiscal year 2009
General and administrative expenses increased due to increased legal charges, as discussed above within
Corporate-Level Activity, and transition expenses associated with the inception of the Yahoo! Commercial
Agreement. These increases were offset in part by a 6% reduction in headcount-related expenses.