Microsoft 2010 Annual Report Download - page 21
Download and view the complete annual report
Please find page 21 of the 2010 Microsoft annual report below. You can navigate through the pages in the report by either clicking on the pages listed below, or by using the keyword search tool below to find specific information within the annual report.-
 1
1 -
2
-
3
-
4
-
5
-
6
-
7
-
8
-
9
-
10
-
 11
11 -
 12
12 -
 13
13 -
 14
14 -
 15
15 -
 16
16 -
 17
17 -
 18
18 -
 19
19 -
 20
20 -
 21
21 -
 22
22 -
 23
23 -
 24
24 -
 25
25 -
 26
26 -
 27
27 -
 28
28 -
 29
29 -
 30
30 -
 31
31 -
32
-
33
-
34
-
35
-
36
-
37
-
38
-
39
-
40
-
41
-
42
-
43
-
44
-
45
-
46
-
47
-
48
-
49
-
50
-
51
-
52
-
53
-
54
-
55
-
56
-
57
-
58
-
59
-
60
-
61
-
62
-
63
-
64
-
65
-
66
-
67
-
68
-
69
-
70
-
71
-
72
-
73
-
74
-
75
-
76
-
77
-
78
-
79
-
80
 |
 |

20
OSD operating loss increased due to increased cost of revenue and research and development expenses, and
decreased revenue. Cost of revenue increased $700 million or 82%, primarily driven by increased online traffic
acquisition, data center and equipment, and headcount-related costs. Research and development expenses
increased $153 million or 17%, primarily due to increased headcount-related expenses.
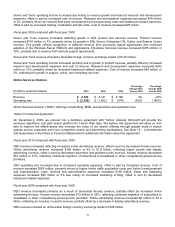
Microsoft Business Division
(In millions, except percentages) 2010 2009 2008
Percentage
Change 2010
Versus 2009
Percentage
Change 2009
Versus 2008
Revenue $ 18,642 $ 18,910 $ 18,899 (1)% 0%
Operating income $11,776 $ 11,664 $ 11,859 1% (2)%
Microsoft Business Division (“MBD”) offerings consist of the Microsoft Office system and Microsoft Dynamics
business solutions. Microsoft Office system products are designed to increase personal, team, and organization
productivity through a range of programs, services, and software solutions. Microsoft Office system offerings
generate over 90% of MBD revenue. Microsoft Dynamics products provide business solutions for financial
management, customer relationship management, supply chain management, and analytics applications for small
and mid-size businesses, large organizations, and divisions of global enterprises. We evaluate our results based
upon the nature of the end user in two primary parts: business revenue, which includes Microsoft Office system
revenue generated through volume licensing agreements and Microsoft Dynamics revenue; and consumer revenue,
which includes revenue from retail packaged product sales and OEM revenue.
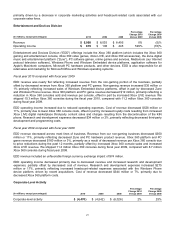
Fiscal year 2010 compared with fiscal year 2009
MBD revenue decreased primarily as a result of the net deferral of $254 million of revenue related to eligible sales of
the 2007 Microsoft Office system with a guarantee to be upgraded to the 2010 Microsoft Office system at minimal or
no cost (the “Office 2010 Deferral”). Consumer revenue decreased $166 million or 5%, primarily due to the Office
2010 Deferral, offset in part by growth in the PC market and sales of the 2010 Microsoft Office system, which was
launched during the fourth quarter. Business revenue decreased $102 million or 1%, primarily reflecting a decline in
licensing of the 2007 Microsoft Office system to transactional business customers, offset in part by growth in multi-
year volume licensing agreement revenue and licensing of the 2010 Microsoft Office system to transactional
business customers. Microsoft Dynamics revenue was flat.
MBD operating income increased due mainly to decreased operating expenses, offset in part by decreased revenue.
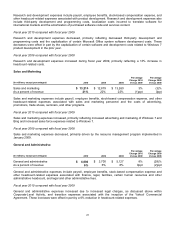
Sales and marketing expenses decreased $266 million or 6%, primarily driven by a decrease in corporate marketing
activities. Research and development expenses decreased $187 million or 11%, primarily as a result of capitalization
of certain Microsoft Office system software development costs and lower headcount-related expenses. General and
administrative expenses decreased $53 million or 18% primarily due to expenses in the prior year associated with
the acquisition of Fast Search & Transfer ASA (“FAST”) and lower headcount-related expenses. These decreases
were offset in part by a $126 million or 11% increase in cost of revenue, primarily driven by increased traffic
acquisition costs and increased costs of providing services.
Fiscal year 2009 compared with fiscal year 2008
MBD revenue was flat reflecting increased business revenue offset by decreased consumer revenue. Business
revenue increased $458 million or 3%, primarily reflecting growth in volume licensing agreement revenue and
included a 7% decrease in Microsoft Dynamics customer billings. The growth in volume licensing agreement revenue
primarily reflects recognition of deferred revenue from previously signed agreements. Consumer revenue decreased
$447 million or 12%, primarily as a result of PC market weakness, a shift to lower-priced products, and pricing
promotions on the 2007 Microsoft Office system.
MBD revenue included a favorable foreign currency exchange impact of $378 million.
MBD operating income decreased reflecting increased cost of revenue and research and development expenses,
partially offset by decreased sales and marketing expenses. Cost of revenue increased $134 million or 14% primarily
driven by expenses associated with FAST, which we acquired in April 2008, as well as online services infrastructure
costs. Research and development expenses increased $118 million or 8%, primarily driven by an increase in
headcount-related expenses associated with FAST. Sales and marketing expenses decreased $79 million or 2%,